Gold – Global Central Bank Holdings
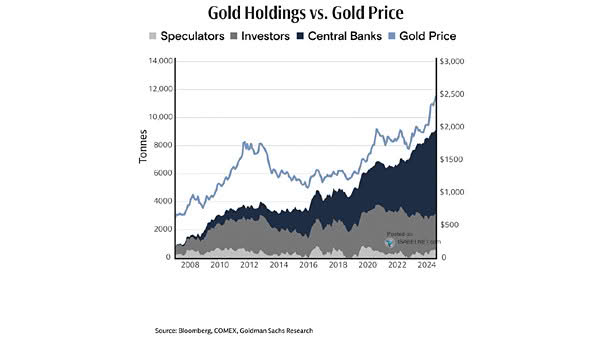
Gold – Global Central Bank Holdings Central bank gold demand cycles respond to global economic and political factors. Recently, demand has increased amid financial instability, currency trust concerns, inflation, sanctions, and geopolitical conflicts. Image: Goldman Sachs Global Investment Research