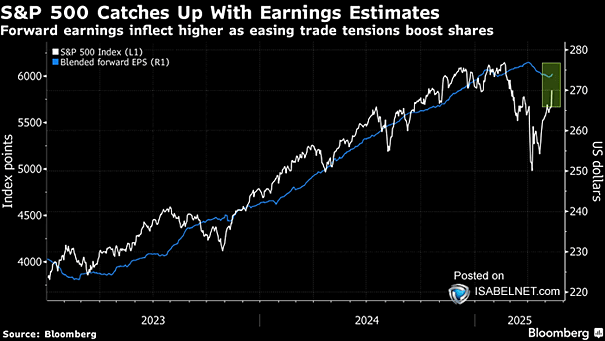
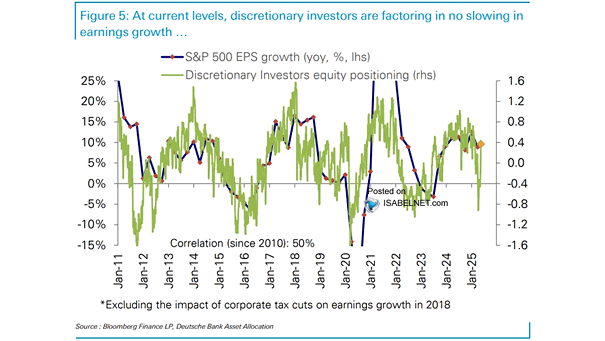
Number of Days from 52 Week High of S&P 500 to Correction (-10%) Level

Number of Days from 52 Week High of S&P 500 to Correction (-10%) Level The current market correction stands out for its swift onset. Among 60 corrections since 1928, this one ranks as the 11th fastest to occur from market highs, leading to abrupt shifts in market sentiment. Image: Deutsche Bank

ISABELNET Cartoon of the Day

ISABELNET Cartoon of the Day As the Fed leaves rates unchanged and tariff concerns persist, bulls are navigating markets like a plane battling turbulent skies—holding firm and hoping for a break in the storm! Have a Great Day, Everyone! 😎

S&P 500 Quarterly EPS

S&P 500 Quarterly EPS Consensus earnings estimates have been reduced more than usual for first quarters, primarily due to the direct impacts of a stronger dollar and tariffs, rather than a broad economic slowdown. Image: Deutsche Bank Asset Allocation

ISABELNET Cartoon of the Day

ISABELNET Cartoon of the Day Wall Street bears think every bull market is just smoke and mirrors. And when the crash finally hits, they love to say, “We told you so!” Happy “Hump” Day, Everyone! 🐫🐪😎

U.S. Economic Surprise Index

U.S. Economic Surprise Index A declining U.S. Economic Surprise Index, caused by economic data consistently underperforming expectations, can negatively impact equity performance. Image: Deutsche Bank Asset Allocation

S&P 500 Performance After Two 90% Advancing Issues in a Row

S&P 500 Performance After Two 90% Advancing Issues in a Row Since 1980, two consecutive days with 90% advancing issues in the S&P 500 have delivered a median return of 16.5% over the following 12 months, with positive returns occurring 90.9% of the time—giving bulls reason to rejoice! Image: Carson Investment Research

ISABELNET Cartoon of the Day

ISABELNET Cartoon of the Day Bears are preparing for the apocalypse, while bulls are partying like it’s 1999, convinced the U.S. economy is recession-proof—until it isn’t! Have a Great Day, Everyone! 😎

SPDR S&P 500 ETF Trust Three-Month 90/110 Implied Volatility

SPDR S&P 500 ETF Trust Three-Month 90/110 Implied Volatility Signs of stability are emerging in the S&P 500 Index after the sharp correction, as traders abandon bets on further significant declines, reflecting growing confidence in the market. Image: Bloomberg

S&P 500 Returns After Quickest Moves into a Correction

S&P 500 Returns After Quickest Moves into a Correction The S&P 500 experienced one of its fastest 10% corrections from an all-time high within a month. Since 1950, it has always been higher 3 and 6 months later, with a median 6-month return of 16.8%, giving bulls reason to smile. Image: Carson Investment Research

ISABELNET Cartoon of the Day

ISABELNET Cartoon of the Day Saint Patrick’s Day brings smiles to bulls as it’s not only one of the greenest days of the year but also historically the best day for U.S. stocks in March—leaving bears feeling unlucky! Happy Saint Patrick’s Day! 😎

Valuation – Bloomberg Magnificent Seven Price Return Index – Best P/E Ratio

Valuation – Bloomberg Magnificent Seven Price Return Index – Best P/E Ratio During the recent market selloff, valuations of major tech companies have plummeted from their previous highs. Many traders believe the downward trend may continue, a sentiment supported by recent historical patterns. Image: Bloomberg