ISM Manufacturing Index and S&P 500 1-Month Return
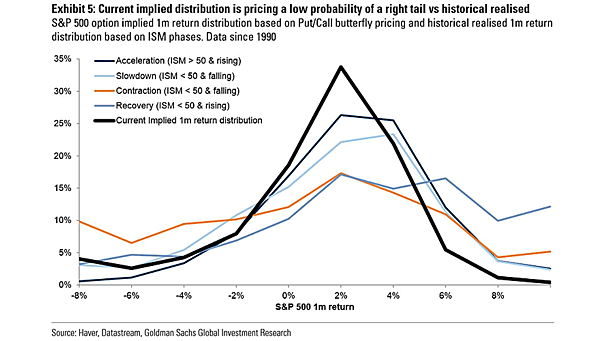
ISM Manufacturing Index and S&P 500 1-Month Return The current S&P 500 option implied 1-month return distribution is pricing a low probability of a right tail relative to historical realised. Image: Goldman Sachs Global Investment Research