Gold and Negative Yielding Debt
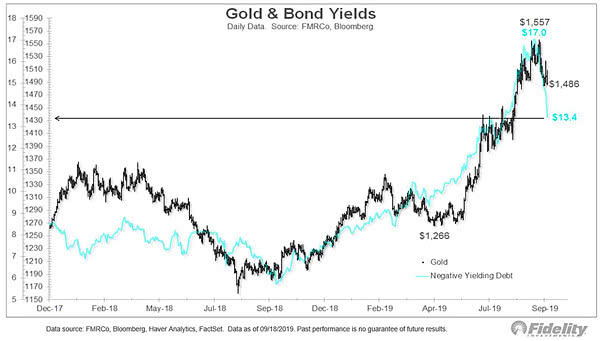
Gold and Negative Yielding Debt This chart shows the strong correlation between gold and market capitalization of global negative yielding debt. Negative global yields are a support for gold.
Gold and Negative Yielding Debt This chart shows the strong correlation between gold and market capitalization of global negative yielding debt. Negative global yields are a support for gold.
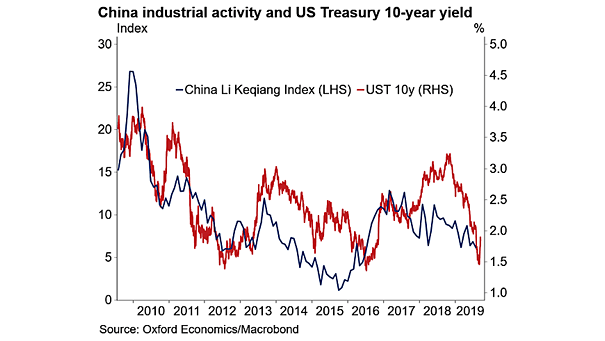
China Industrial Activity and U.S. Treasury 10-Year Yield This chart shows the quite good correlation between China industrial activity and the U.S. treasury 10-year yield. Image: Oxford Economics, Macrobond
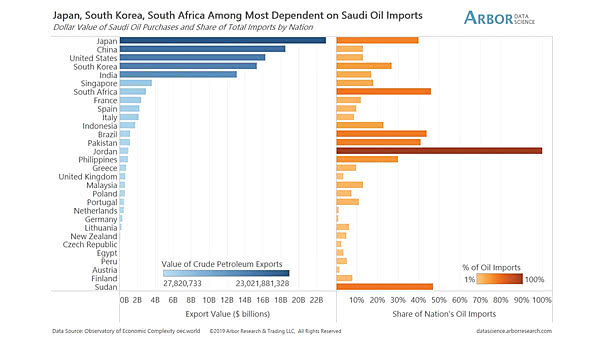
Countries Dependent on Saudi Oil Imports Japan, South Korea and South Africa are among the countries most dependent on Saudi oil imports. Image: Arbor Research & Trading LLC
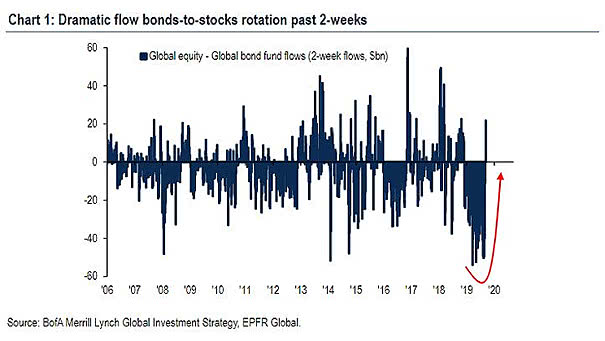
Global Equity – Global Bond Fund Flows In the past two weeks, investors have shifted from bonds to equities. Image: BofA Merrill Lynch Global Investment Strategy
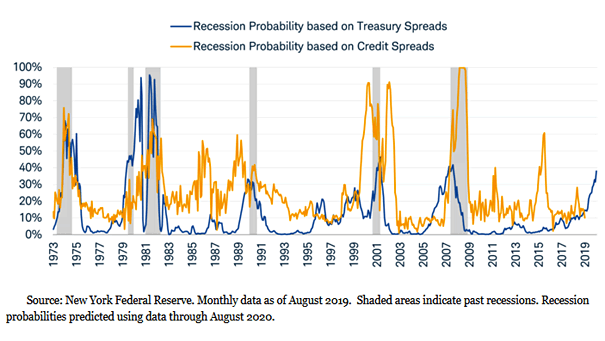
U.S. Recession Probability Based on Credit Spreads and Treasury Spreads This chart suggests that the recession probability is low, about 10% based on credit spreads. Image: Charles Schwab
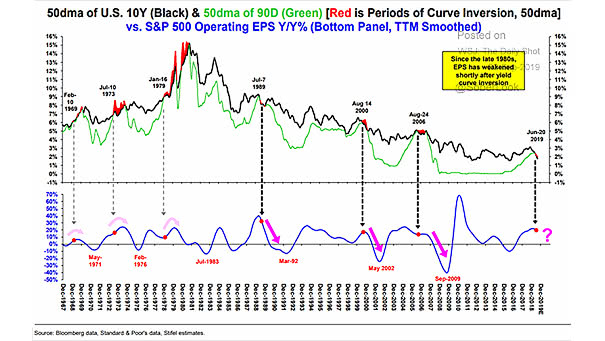
10Y-3M Yield Curve Inversion and S&P 500 Operating EPS The inversion of the yield curve between 3-month and 10-year Treasurys is not good news for S&P 500 operating EPS (90D means 3-month T-bill). The 50 day moving average removes false signals since 1967. Image: Stifel
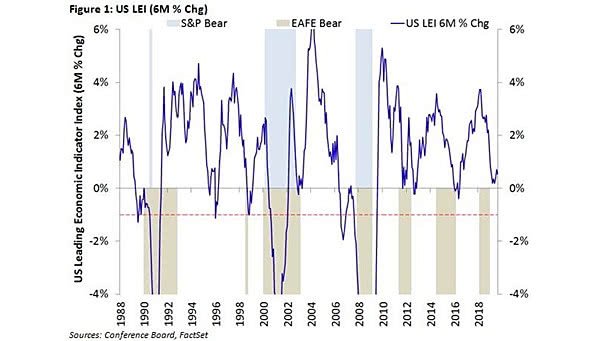
Conference Board Leading Economic Index for U.S. (LEI) LEI suggests that the U.S. economy should continue to expand in H2 2019. Image: Ken Fisher
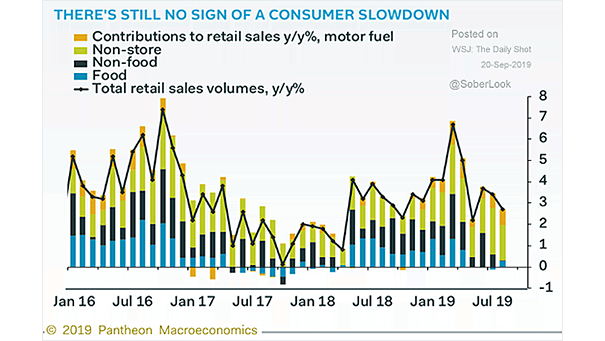
U.S. Total Retail Sales Volumes Chart showing that U.S. retail sales remain solid. Image: Pantheon Macroeconomics
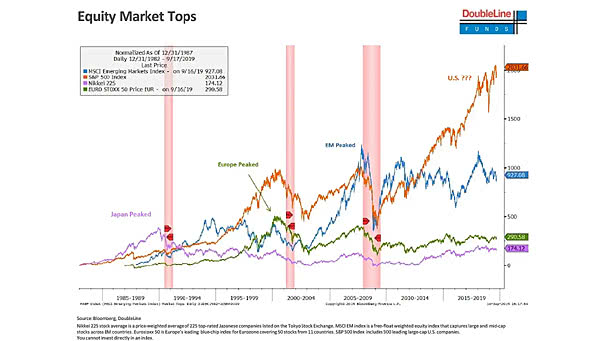
Equity Market Tops Interesting chart showing equity market tops. The U.S. equity market hasn’t yet reached its peak. Image: DoubleLine
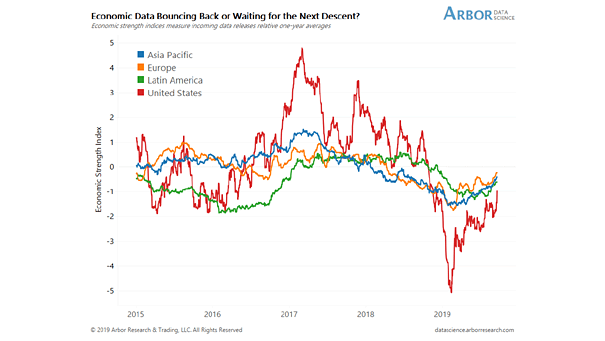
Economic Data Bouncing Back Great chart showing that economic data around the world is beginning to improve. Image: Arbor Research & Trading LLC
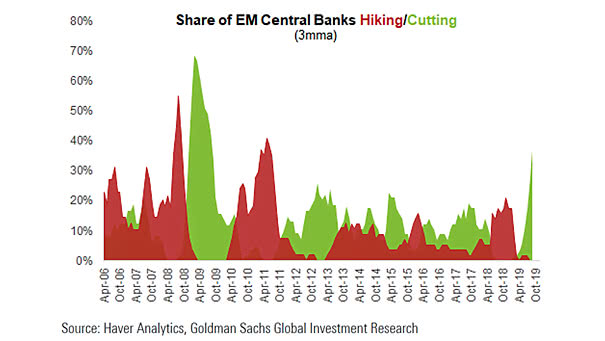
Share of Emerging Market Central Banks Hiking/Cutting Chart showing that emerging market central banks cut rates by most in a decade. Image: Goldman Sachs Global Investment Research