U.S. Real GDP Growth Leads Core Inflation
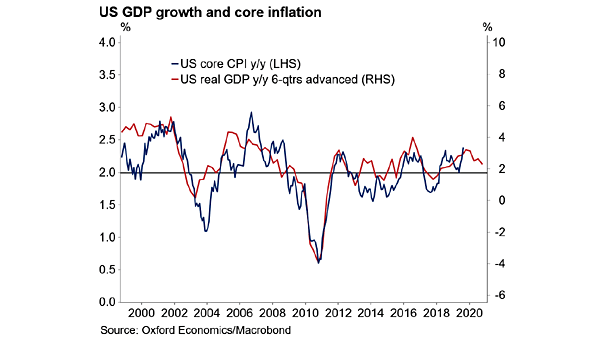
U.S. Real GDP Growth Leads Core Inflation This great chart suggests that U.S. real GDP growth leads core inflation by 18 months. Image: Oxford Economics, Macrobond
U.S. Real GDP Growth Leads Core Inflation This great chart suggests that U.S. real GDP growth leads core inflation by 18 months. Image: Oxford Economics, Macrobond
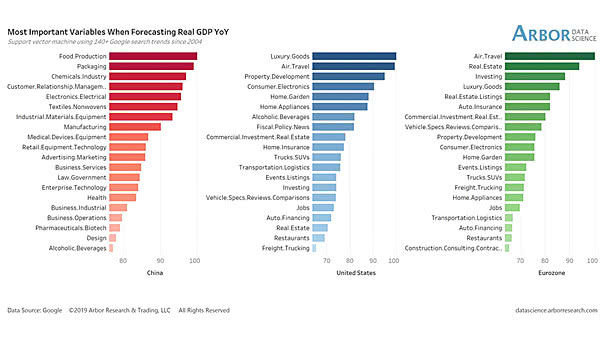
Most Important Variables When Forecasting Real GDP Search trends are very different between China (manufacturing industry) and the USA/Eurozone (consumer), when forecasting real GDP. Image: Arbor Research & Trading LLC
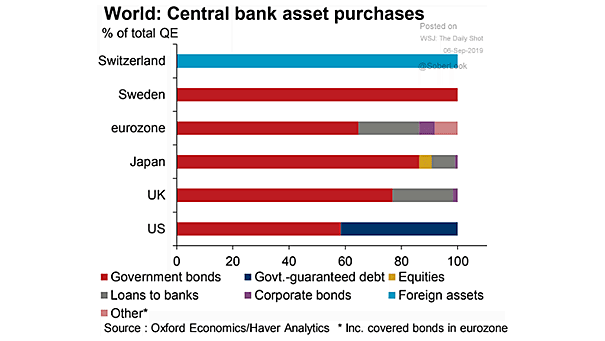
World – Central Bank Asset Purchases Great chart showing central bank asset purchases. Image: Oxford Economics
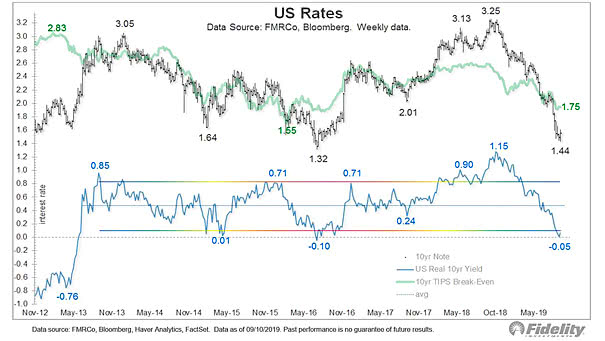
U.S. Rates Chart showing the dramatic plunge in interest rates over the past 10 months. On the positive side, the equity risk premium (ERP) is now higher. Image: Fidelity Investments
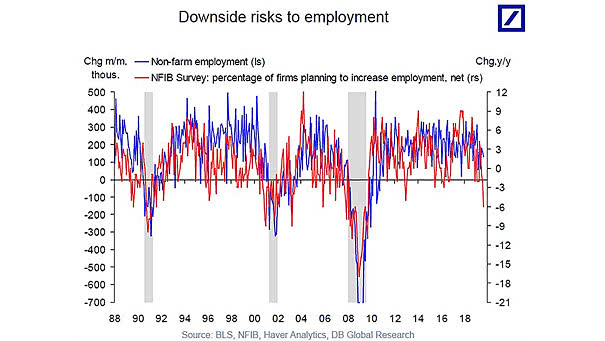
U.S. Nonfarm Employment and NFIB Survey If the trade war continues, it will have serious negative repercussions on the American economy. Image: Deutsche Bank Global Research
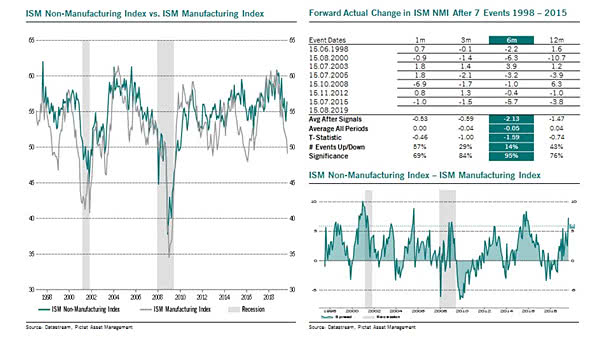
U.S. ISM Non-Manufacturing Index vs. U.S. ISM Manufacturing Index and Recessions Interesting chart showing the spread between the U.S. ISM Non-Manufacturing Index and the U.S. ISM Manufacturing Index over time. Image: Pictet Asset Management
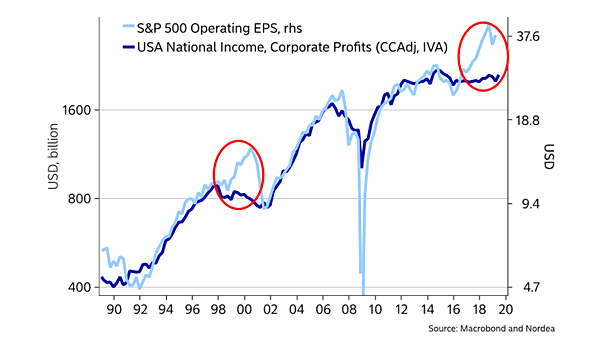
S&P 500 Operating EPS vs. USA National Income, Corporate Profits Thanks to buybacks, this chart clearly shows the current divergence. Is a new bubble being formed? Image: Nordea and Macrobond
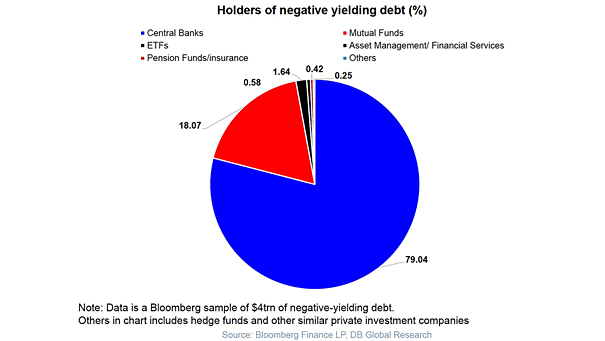
Holders of Negative Yielding Debt Central banks hold 79% of negative-yielding debt. Image: Deutsche Bank Global Research
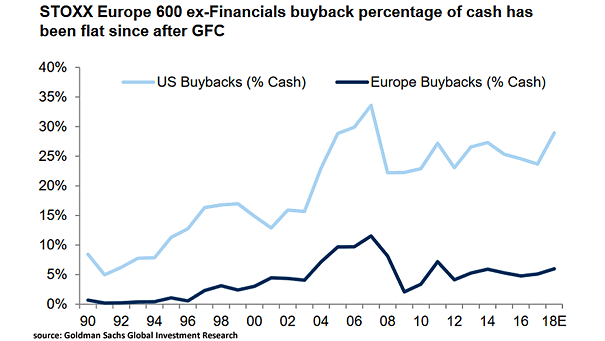
U.S. and European Buybacks U.S. and European buybacks as percentage of cash are not at their pre-global financial crisis levels. Image: Goldman Sachs Global Investment Research
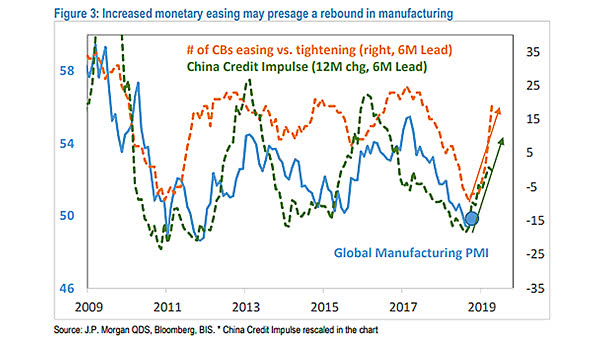
China Credit Impulse and Number of Central Banks Easing vs. Tightening Lead Global Manufacturing PMI This chart suggests that China credit impulse and the number of central banks easing vs. tightening lead global manufacturing PMI by 6 months. Credit impulse is the change in new credit issued as a percentage of GDP. Image: J.P. Morgan
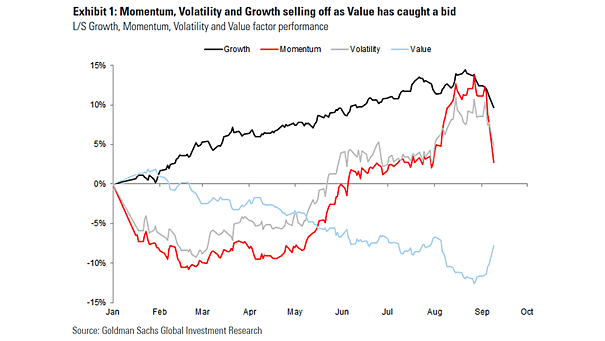
Growth, Momentum, Volatility and Value Factor Performance Chart showing that value stocks make a comeback as momentum and growth stocks get hammered. Image: Goldman Sachs Global Investment Research