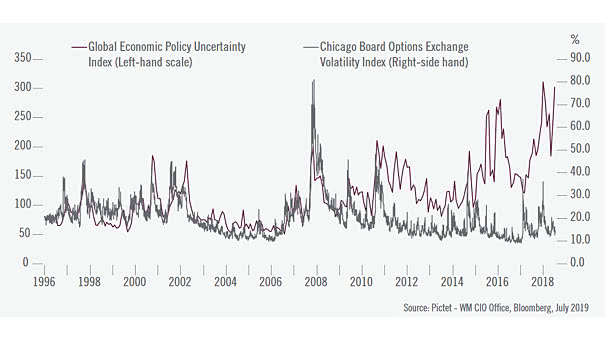
U.S. Private Sector Yield Curve
U.S. Private Sector Yield Curve Currently, the U.S. private sector yield curve (20-year Baa bonds/bank prime rate) is the most inverted since October 2007. Image: GnS Economics
U.S. Monetary Policy and Recession This chart shows the U.S. monetary policy and two recession forecasting models over time (Fed policy rate, Atlanta Fed shadow Fed funds rate, nominal R-Star, Fed funds curve). Image: Fidelity Investments
Who Owns Different Countries’ Government Bonds? About 70% of the U.S. national debt is owned by domestic government, institutions investors and the Federal Reserve. Image: Deutsche Bank Global Research
Hedge Fund Portfolio Density and Turnover Hedge fund portfolio density has steadly increased, and fund turnover has declined over the past decade. High concentration risk can lead to high losses and affect the financial system. Image: Goldman Sachs
World’s Largest Companies by Revenue The visualization presents the top 100 companies making the most money in 2019 Image: howmuch.net
Total Negative Yielding Corporate Bonds Outstanding Negative-yielding corporate debt passed $1 trillion in market value. Investors face significant risk should rates start to rise. Image: Bianco Research
U.S. Long-Term Budget Outlook Large budget deficits over the next 30 years could boost federal debt to unprecedented levels. Image: Congressional Budget Office
Total Number of Governments since 1945 Italy and France have the largest number of governments since 1945, while the U.S. and Luxembourg have the smallest number. Image: Deutsche Bank Global Research
A Hall of Mirrors in Monetary Policy? This chart suggests a feedback loop between bond market pricing and central bank decisions. Image: Goldman Sachs Global Investment Research
U.S. Excess Liquidity Growth Leads S&P 500 Returns This chart suggests that M2 money supply to nominal GDP ratio leads S&P 500 returns by one year. Is the S&P 500 vulnerable to a drop, followed by a recovery? Image: Oxford Economics, Macrobond
Productivity: How Productive is an Hour of Work? An hour’s work in Ireland contributes $102.3 to the economy, while in the U.S., this contribution is on average $72.1 Image: Statista