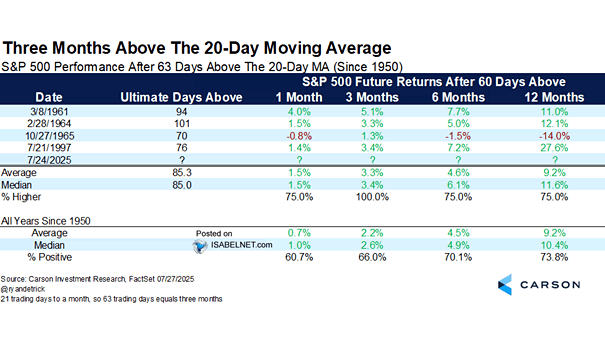
S&P 500 Performance After 63 Days Above the 20-Day Moving Average
S&P 500 Performance After 63 Days Above the 20-Day Moving Average After closing above its 20-day moving average for 63 straight days, the S&P 500 has, in the past, continued to rise over the following 3 months, achieving median gains of 3.4% and positive returns every time. Image: Carson Investment Research