S&P 500 – Margin Debt Expansion vs. Contraction
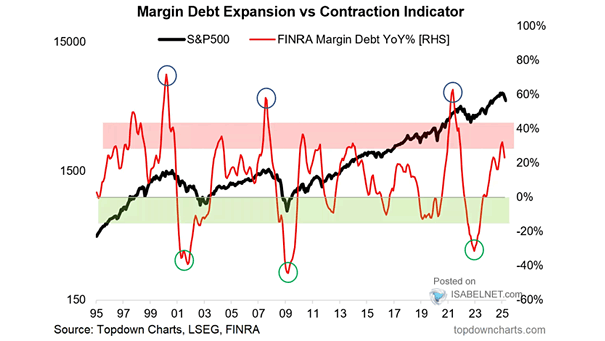
S&P 500 – Margin Debt Expansion vs. Contraction Margin debt rolling over from the danger zone isn’t exactly the kind of move bulls want to see. It’s a red flag for the market and definitely something to keep an eye on. Image: Topdown Charts