U.S. 10-Year Treasury Bond Yield vs. U.S. Nominal GDP
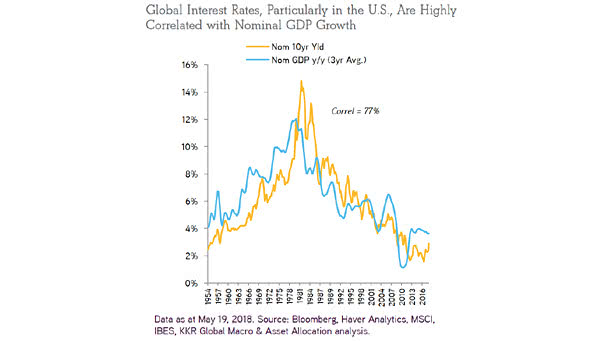
U.S. 10-Year Treasury Bond Yield vs. U.S. Nominal GDP The U.S. 10-year Treasury bond yield is highly correlated with the U.S. nominal GDP growth (correlation = 77%). Image: KKR Global Macro
U.S. 10-Year Treasury Bond Yield vs. U.S. Nominal GDP The U.S. 10-year Treasury bond yield is highly correlated with the U.S. nominal GDP growth (correlation = 77%). Image: KKR Global Macro
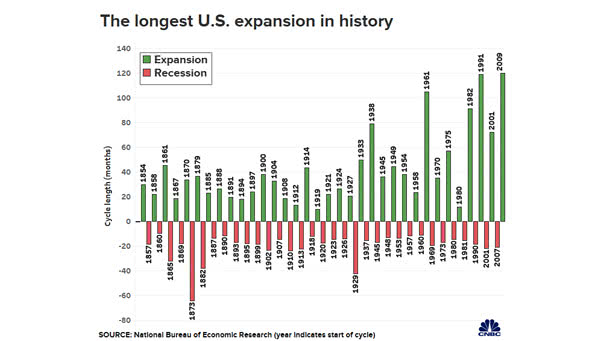
The Longest Economic Expansion in American History The U.S. GDP has grown for 121 consecutive months since the Great Recession. This is officially the longest U.S. economic expansion in history. You may also like “Strength of Economic Expansions.” Image: CNBC
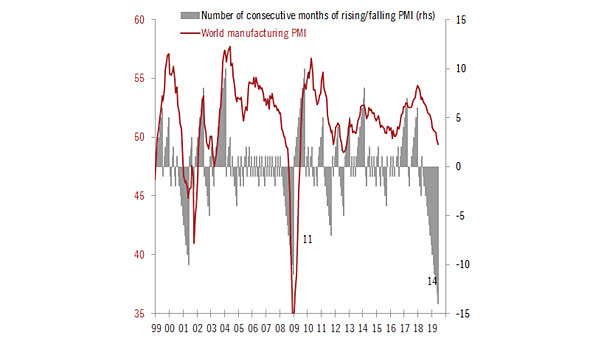
World Manufacturing PMI World manufacturing PMI declined again. This is the longest consecutive decline (14 months). Image: Frederik Ducrozet
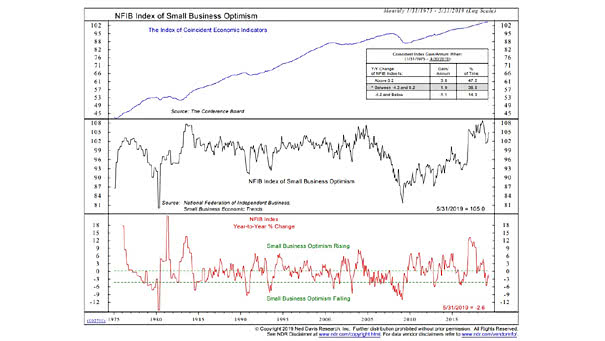
NFIB Small Business Optimism Index The Small Business Optimism Index is driving economic growth. It is a good indicator of the health of small businesses in the U.S.. Image: Ned Davis Research
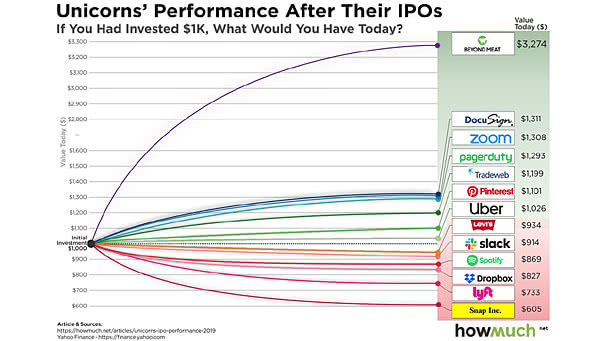
Unicorn’s Performance After Their IPOs A unicorn is a privately held startup company with a value of over $1 billion. The chart below shows the value today, if you had invested $1000 at the time of the IPOs. You may also like “IPOs Tend to Underperform the Market.” Image: howmuch.net
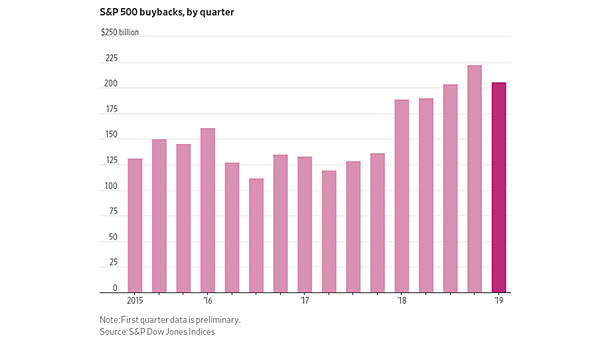
S&P 500 Share Buybacks by Quarter Share buybacks have contracted for the first time since 2017, as trade tensions and economic slowdown worry U.S. firms. Image: The Wall Street Journal
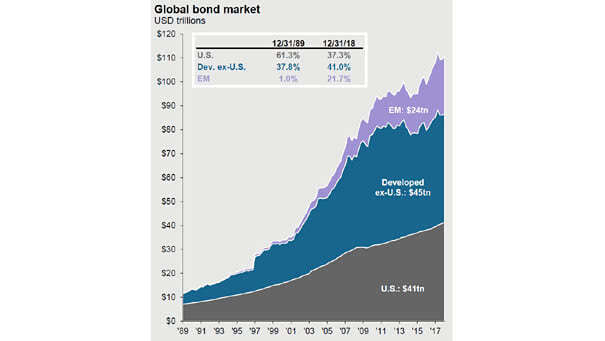
Global Bond Market This chart shows the growing global “bond bubble.” Since 2000, the global bond market has tripled in size. Image: J.P. Morgan Asset Management
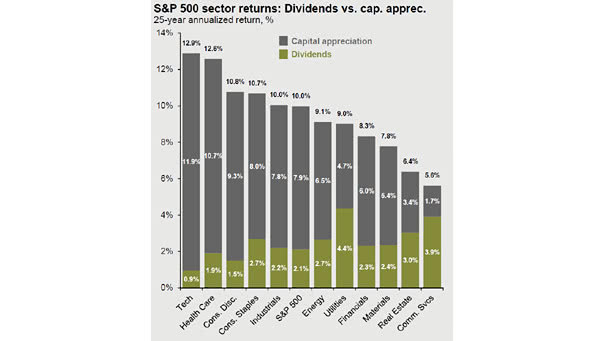
S&P 500 Sector Returns: Dividends vs. Capital Appreciation Great chart showing the S&P 500 sector returns over the last 25 years. Image: J.P. Morgan Asset Management
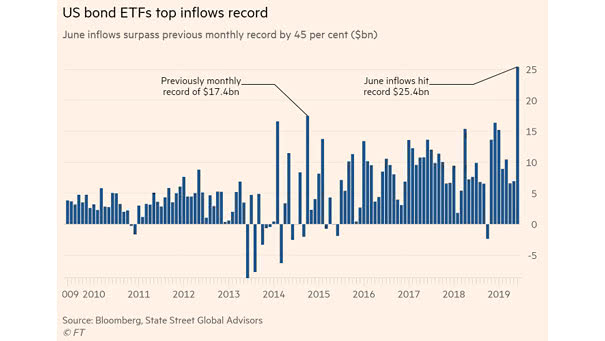
U.S. Bond ETFs Top Inflows Record In June, investors significantly increased their exposure to bond funds, as weak economic data fuels slowdown worries. U.S. bond ETFs inflows hit $25.4bn. Image: Financial Times
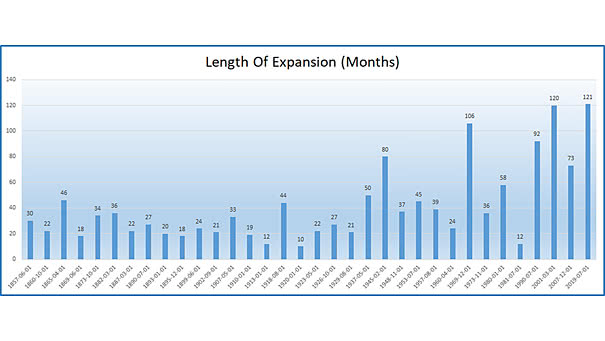
Longest Economic Expansion in U.S. History Since the Great Recession, the U.S. economy has grown for 121 consecutive months. This is the longest economic expansion in American history. You may also like “Strength of Economic Expansions.” Image: Ryan Detrick, LPL Financial LLC
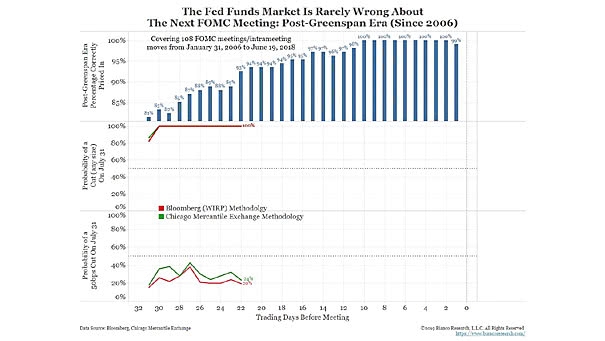
Before the Next FOMC Meeting, the Fed Funds Market Is Pretty Accurate Probability of a Fed rate cut on July 31, 2019: 100% (Fed funds market expectation). Image: Bianco Research