U.S. Employment by Sector since 1850
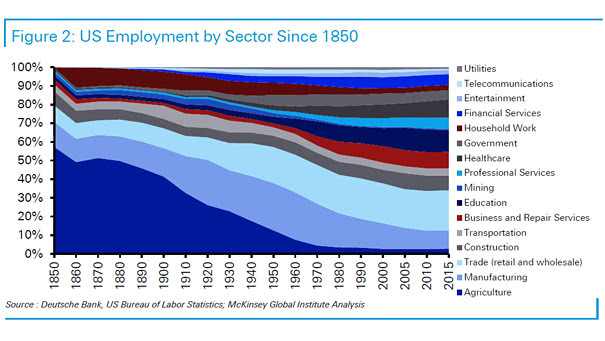
U.S. Employment by Sector since 1850 Over time, the U.S. employment became less dependent on agriculture and much more diversified. Image: Deutsche Bank
U.S. Employment by Sector since 1850 Over time, the U.S. employment became less dependent on agriculture and much more diversified. Image: Deutsche Bank
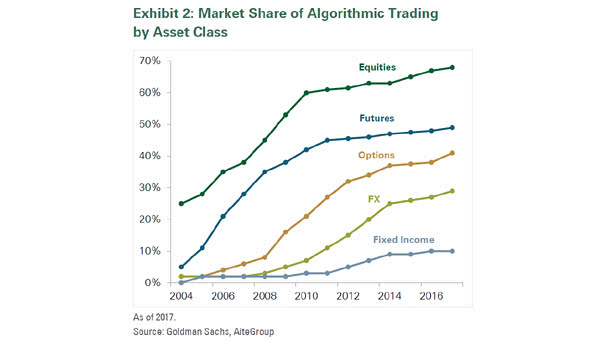
Market Share of Algorithmic Trading by Asset Class Algorithmic trading has grown across asset classes, particularly in equities. Image: Goldman Sachs Global Investment Research
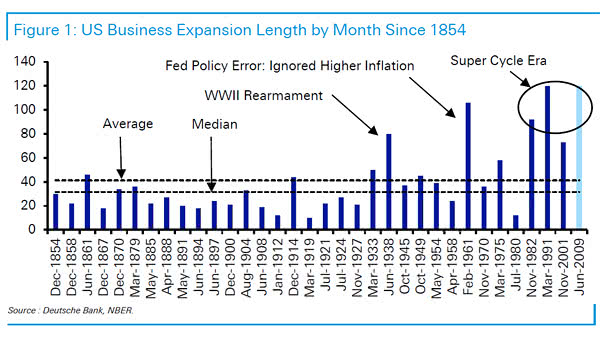
U.S. Business Expansions Length by Month since 1854 Since 1854, the U.S. was in recession 35% of the time. U.S. recessions are becoming rarer over time and partly explain the increasing survival of zombie firms. Image: Deutsche Bank
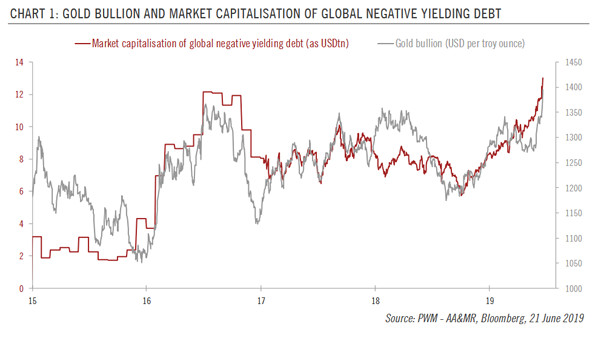
Gold Bullion and Market Capitalization of Global Negative Yielding Debt This chart shows a strong correlation between gold and market capitalization of global negative yielding debt. Keep in mind that negative global yields are a support for gold. Image: Pictet Wealth Management
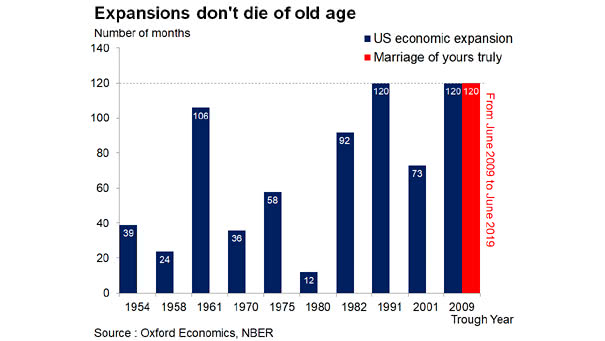
Economic Expansions Don’t Die of Old Age Today, the current economic cycle is the longest expansion. Image: Oxford Economics
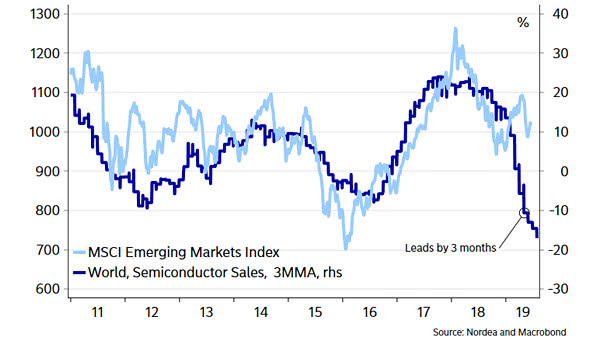
MSCI Emerging Markets Index vs. World Semiconductor Sales This great chart suggests that world semiconductor sales lead the MSCI emerging markets index by 3 months. Very interesting chart before investing in emerging market equities. Country weights of the MSCI Emerging Markets Index: 33% China, 13.02% Korea, 11.35% Taiwan. Image: Nordea and Macrobond
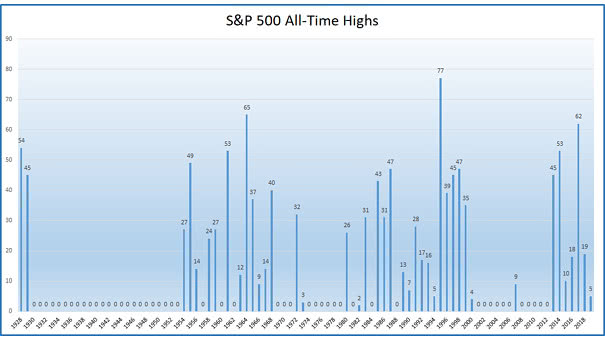
S&P 500 All-Time Highs Great chart showing the 1,140 all-time highs of the S&P 500 since the Second World War. Image: Ryan Detrick, LPL Financial LLC
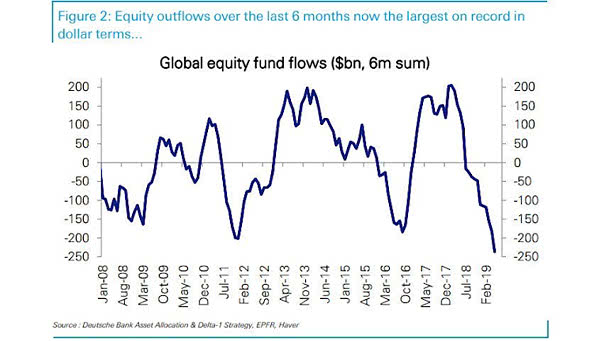
Global Equity Fund Flows This great chart from Deutsche Bank shows that equity outflows over the last 6 months are now the largest on record. In 2011 and 2016, it was similar and equities rose significantly. Image: Deutsche Bank
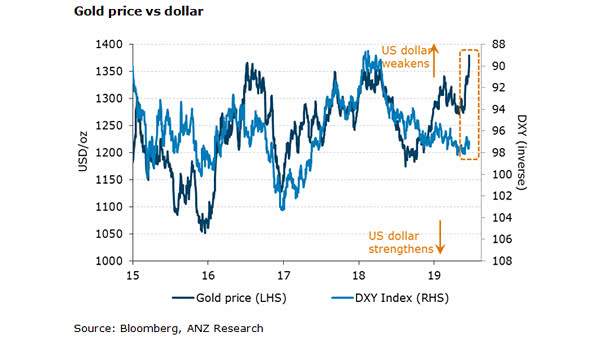
Gold Price vs. U.S. Dollar Currently, when the U.S. dollar is weaker, the price of gold is higher, as shown in this nice chart below. But it’s not always the case. Image: ANZ Research
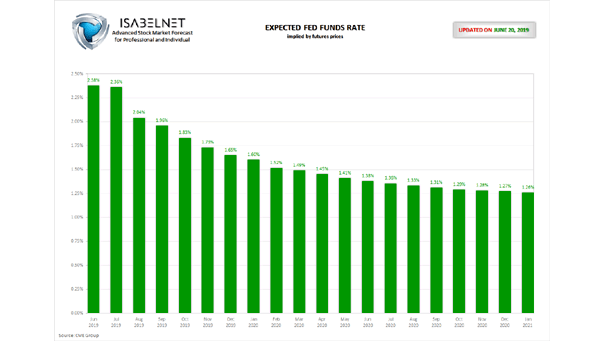
Expected Fed Funds Rate as of June 20, 2019 Fed funds futures for January 2021 imply an expected rate of only 1.26% (traders are pricing in more than four full cuts). You may also like “Markets Have Accurately Priced in Cuts before Easing Cycles Begin.”
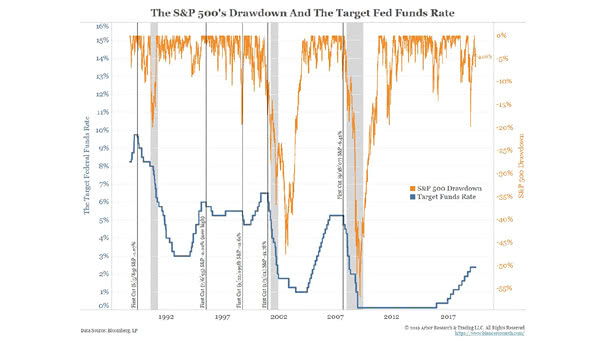
The S&P 500’s Drawdown and The Target Fed Funds Rate Fed rate cuts have generally been associated with recessions and drawdowns. Image: Bianco Research