Change in the Summary of Economic Projections
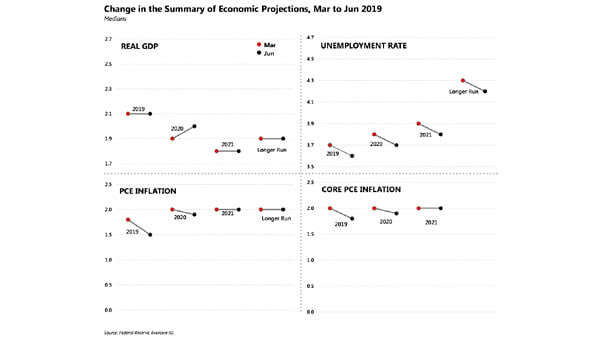
Change in the Summary of Economic Projections This chart shows the change in the summary of economic projections from March to June 2019. Image: Evercore ISI
Change in the Summary of Economic Projections This chart shows the change in the summary of economic projections from March to June 2019. Image: Evercore ISI
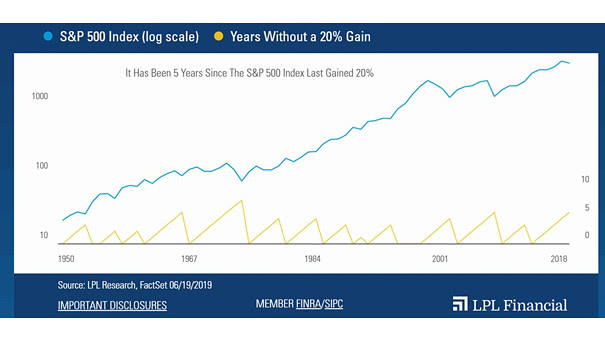
Years Without a 20% Gain for the S&P 500 Index This great chart shows the number of years without a 20% gain since 1950. Could the S&P 500 gain 20% this year? Image: LPL Research
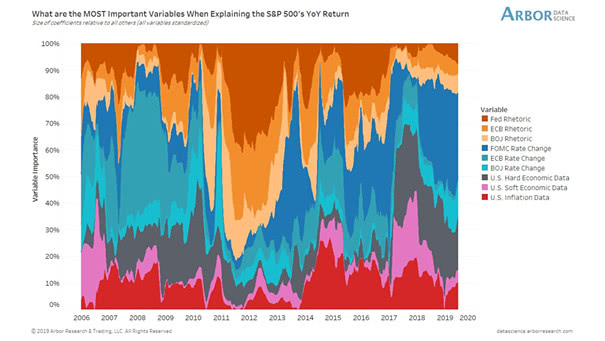
Most Important Variables Explaining the S&P 500’s YoY Return Today, the two most important variables explaining the S&P 500’s YoY return: FOMC rate change and U.S. hard economic data. Image: Arbor Research & Trading LLC
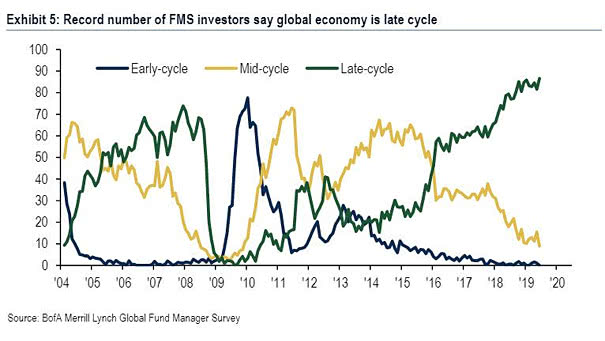
Global Economy Is Late Cycle This chart shows that a record number of fund managers think the global economy is late cycle. Image: Bank of America Merrill Lynch
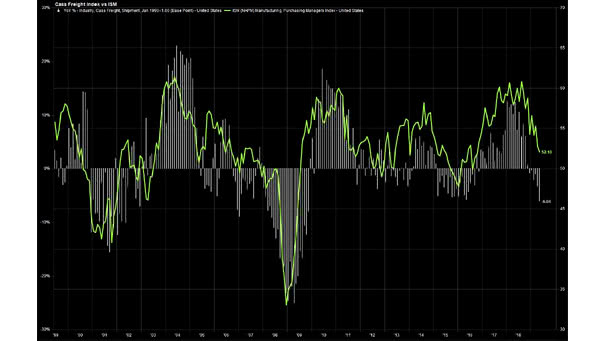
ISM Manufacturing Index vs. Cass Freight Index The Cass Freight Index (white bar chart) is a measure of monthly North American freight activity. It suggests that the ISM Manufacturing Index (green line) could go lower if the U.S. economic slowdown persists. Image: Greg S.
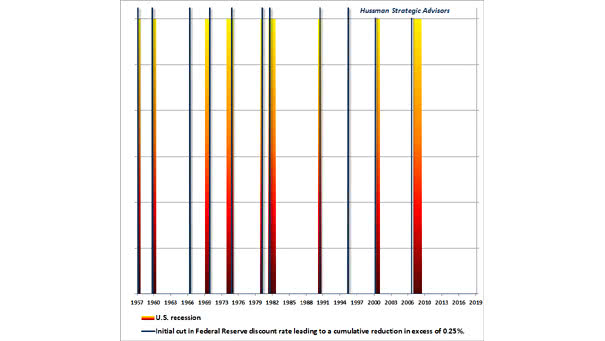
U.S. Recessions since 1957 This chart shows that almost every Fed rate cut has been associated with a recession. Image: John P. Hussman
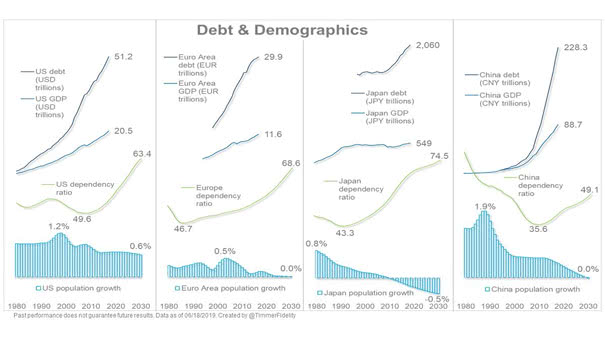
Debt and Demographics Our world is aging with high levels of debt and low interest rates (maybe for a long time). Image: Fidelity Investments
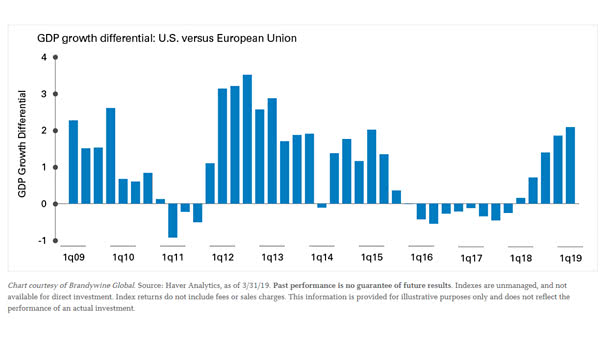
GDP Growth Differential: U.S. vs. European Union U.S. GDP growth has been stronger than in the European Union in 28 of the last 40 quarters. It can explain why the U.S. dollar has been so strong relative to the euro. Image: Brandywine Global
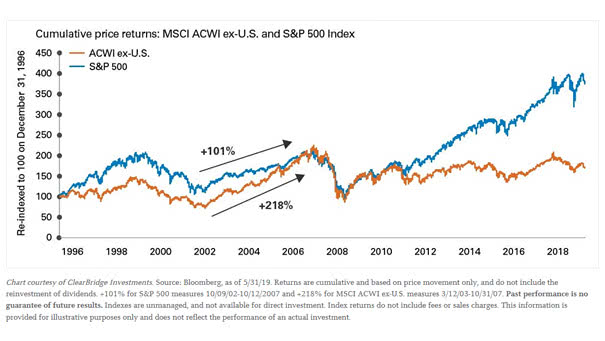
MSCI ACWI ex-U.S. and S&P 500 Index U.S. equities have significantly outperformed the rest of the world in recent years, but this has not always been the case. You may also like “Trailing 12-month Return Differential between U.S. and non-U.S. Stocks.” Image: ClearBridge Investments
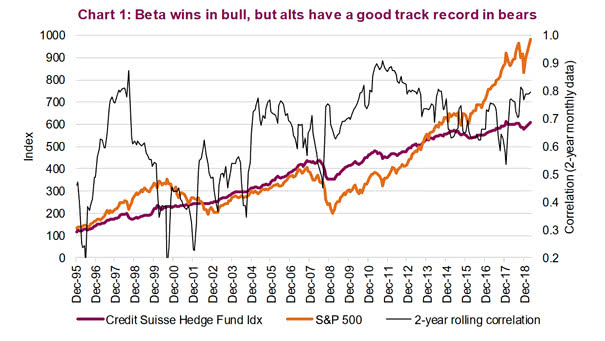
Performance of Hedge Fund Index vs. S&P 500 Hedge fund returns have not been as good as those of the S&P 500, but volatility has been lower. Image: Richardson Wealth
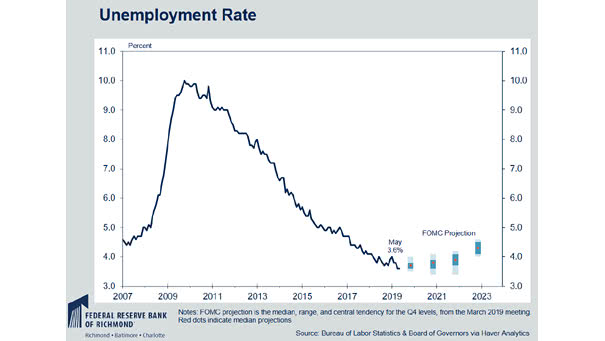
The U.S. Unemployment Rate Is Historically Low But the FOMC projection suggests that the unemployment rate cannot improve indefinitely. Image: Federal Reserve Bank of Richmond