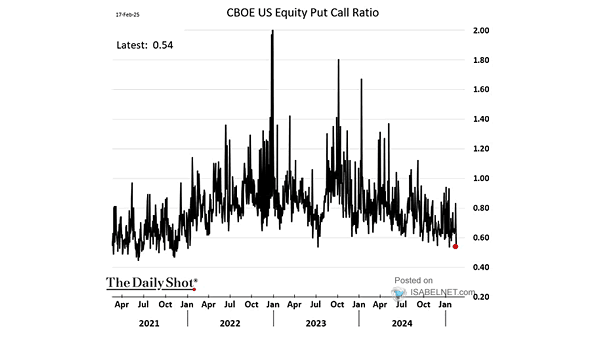
Sentiment – CBOE Equity Put/Call Ratio

Sentiment – CBOE Equity Put/Call Ratio The current U.S. equity put/call ratio indicates a broadly bullish sentiment, implying that investors are confident about the market’s future performance, for now. Image: The Daily Shot
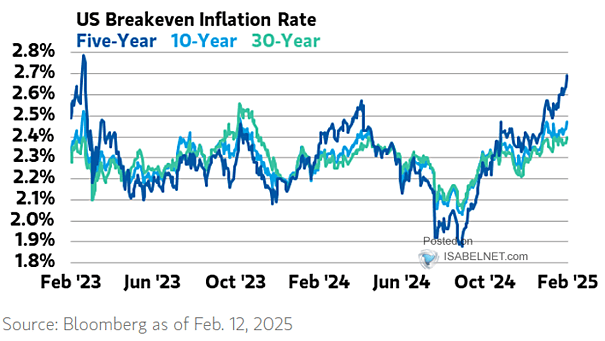
U.S. Breakeven Inflation Rate

U.S. Breakeven Inflation Rate Breakeven rates, which reflect the market’s inflation expectations, suggest that the fight against rising prices is far from over and will likely continue in the foreseeable future. Image: Morgan Stanley Wealth Management

Fed Balance Sheet

Fed Balance Sheet The ongoing reduction of the Fed’s balance sheet is expected to reduce bank reserves. This reduction may lead to higher inflation, increased real yields, and a steeper yield curve. Image: TS Lombard

S&P 500 After Election Day

Post-Election Day S&P 500 Returns While investors have responded positively to the election results, the true effects of new policies remain uncertain. The market’s robust performance is based on expectations, not realized economic outcomes. Image: Bloomberg

ISABELNET Cartoon of the Day

ISABELNET Cartoon of the Day The S&P 500’s 1.47% increase last week hasn’t dampened bears’ endless pessimism. Meanwhile, bulls are too busy celebrating a 4.11% year-to-date gain, including dividends! Have a Great Day, Everyone! 😎

Europe Equity Fund Flows

Europe Equity Fund Flows European equity funds have experienced a surge in inflows, reaching a two-year high and indicating a notable shift in market sentiment. Image: Deutsche Bank Asset Allocation

S&P 500 Earnings Estimates

S&P 500 Earnings Estimates Morgan Stanley forecasts S&P 500 earnings per share to hit $271 in 2025 and $303 in 2026, indicating a bullish market outlook. Image: Morgan Stanley Wealth Management

S&P 500 Index Single Day Average Returns

S&P 500 Index Single Day Average Returns Historically, the S&P 500 has shown a tendency to underperform in the latter half of February, potentially due to a combination of seasonal market patterns and investor sentiment. Image: Carson Investment Research

Instances When S&P 500 Longer-Term Rally Stalls

Instances When S&P 500 Longer-Term Rally Stalls Historically, periods of strong annual stock gains of over 20% followed by short-term flat performance have often led to weaker returns in the following 3 to 6 months. Image: MarketDesk Research

AAII – U.S. Retail Investors Allocation to Stocks, Bonds and Cash

AAII – U.S. Retail Investors Allocation to Stocks, Bonds and Cash High equity allocations and low cash positions don’t always mean a market reversal is near. However, they suggest that much of the market’s potential gains may already be priced in, as investors have heavily committed to equities. Image: Real Investment Advice