Why the Unemployment Rate to 3.6% in April 2019 Is Not So Great?
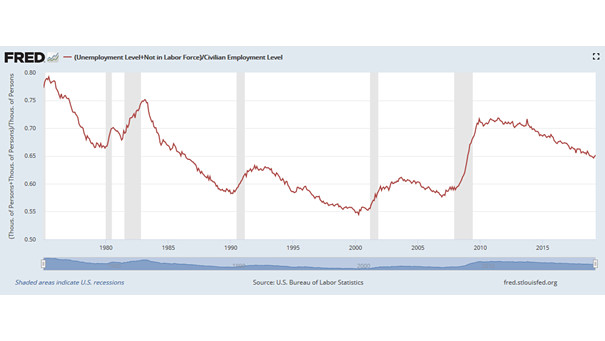
Why the Unemployment Rate to 3.6% in April 2019 Is Not So Great? Well, the unemployment level is the lowest since 1969, but when we compare the level of unemployment plus people not in the labor force, to the level of employment, the picture is not so rosy. Ouch!