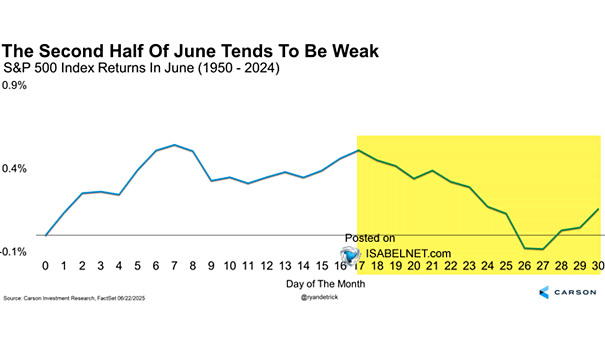
Oil Price vs. U.S. 10-Year Breakeven Inflation Rate

Oil Price vs. U.S. 10-Year Breakeven Inflation Rate Since the 2008 global financial crisis, U.S. breakeven inflation has closely tracked crude oil prices, reflecting the significant impact of oil price fluctuations on inflation expectations and overall economic conditions. Image: Bloomberg

Valuation – Russell 2000 vs. S&P 500

Valuation – Russell 2000 vs. S&P 500 The current undervaluation of U.S. small-caps relative to the S&P 500 presents an attractive investment opportunity for those looking to diversify their portfolios and potentially capture higher returns in the coming years. Image: Fundstrat Global Advisors, LLC

Long History of U.S. 10-Year Treasury Yields

Long History of U.S. 10-Year Treasury Yields Despite expectations of rate cuts, U.S. interest rates could move in either direction, depending on inflation and Fed decisions. Image: Goldman Sachs Global Investment Research Click the Image to Enlarge

ISABELNET Cartoon of the Day

ISABELNET Cartoon of the Day In a surprising turn of events, Greenland, Canada, and Panama announce joint bid to purchase Florida, claiming “vital access to Mar-a-Lago” as key motivation! Happy Friday, Everyone! 😎

GS CapEx & R&D Index – S&P 500 Index Quarterly Performance

GS CapEx & R&D Index – S&P 500 Index Quarterly Performance The underperformance of stocks with high CapEx and R&D expenditures highlights the tension between long-term corporate investment strategies and investors’ desire for near-term profitability. Image: Bloomberg

Inequality – Inflation Adjusted Household Equity Ownership by Brackets

Inequality – Inflation Adjusted Household Equity Ownership by Brackets Wealth inequality in the U.S. may be further exacerbated by the current stock market ownership structure, where 88% of household equity is controlled by just the top 10% of income earners. Image: Real Investment Advice

Household Asset Allocation

Household Asset Allocation The wealth gap between the rich and the middle/lower classes is significantly influenced by their asset ownership patterns. The wealthy predominantly own equities, while the middle and lower classes tend to invest heavily in real estate. Image: Goldman Sachs Global Investment Research

ISABELNET Cartoon of the Day

ISABELNET Cartoon of the Day Bulls can’t stop laughing as gold trades at all-time high, with Goldman Sachs forecasting a glittering path to $3,000 per ounce by December 2025, fueled by central banks’ insatiable gold-buying appetite and potential rate cuts. Have a Great Day, Everyone!😎

January Barometer – S&P 500 Price Return

January Barometer – S&P 500 Price Return Momentum often snowballs, regardless of timing. Bulls are smiling as a bullish January performance often sets a positive tone for the entire year in the U.S. stock market. Image: Fidelity Investments

ISABELNET Cartoon of the Day

ISABELNET Cartoon of the Day Wall Street bears, with their trademark grumpy demeanor, are convinced the bull market is a joke – meanwhile, bulls are gleefully high-fiving their portfolios and keep laughing all the way! Happy “Hump” Day, Everyone! 🐫🐪😎

Tariffs and U.S. Government Revenues

Tariffs and U.S. Government Revenues Tariffs played a crucial role in the early industrialization of the United States, but their effectiveness in today’s global economy are potentially detrimental as they act as an economic drag, hurting more industries than they help. Image: Deutsche Bank