Tech Equity Flows

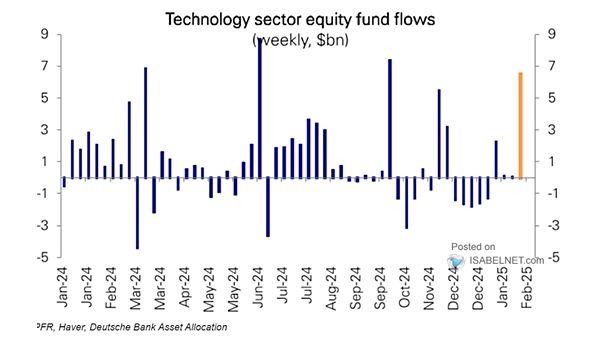
Tech Equity Flows The DeepSeek selloff was followed by significant tech inflows, highlighting the resilience of investor confidence in the technology sector, despite short-term market fluctuations. Image: Deutsche Bank Asset Allocation
Market Capitalization of the S&P 493 as Share of Index Total

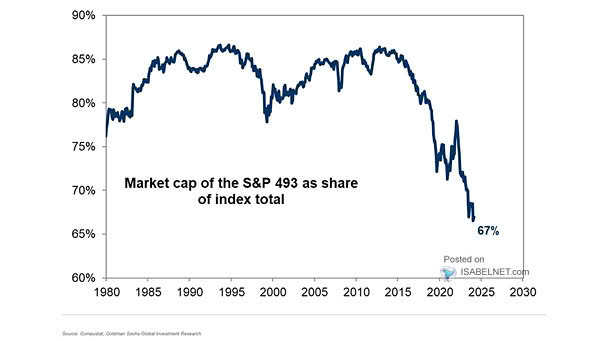
Market Capitalization of the S&P 493 as Share of Index Total The 493 smallest stocks in the S&P 500 now account for just 67% of the index’s market capitalization, a record low. This reflects a trend where a few large companies dominate, raising concerns about market concentration. Image: Goldman Sachs Global Investment Research

S&P 500 and 10-Month Moving Average

S&P 500 and 10-Month Moving Average The S&P 500’s 2.78% gain in January, including dividends, underscores the strength of the cyclical bull market that began in late 2022. Current conditions suggest continued growth potential. Image: Topdown Charts

S&P 500 Performance When >2% YTD Return in January

S&P 500 Performance When >2% YTD Return in January Bulls have reason to smile: historically, when the S&P 500 index rises more than 2% in January, it’s a good omen. Since 1951, such starts have led to average annual returns of 18.4%, with positive years 88% of the time. Image: Carson Investment Research

World Technology Earnings

World Technology Earnings The sustained outperformance of the technology sector since 2010 can largely be explained by its strong profit growth and the disruptive influence of technologies such as artificial intelligence. Image: Goldman Sachs Global Investment Research

S&P 500 Top 5 Stocks’ Weight vs. 1-Year Forward Returns

S&P 500 Top 5 Stocks’ Weight vs. 1-Year Forward Returns While the current high market concentration is a significant feature of today’s market landscape, it doesn’t necessarily predict poor performance in the near term. Image: Goldman Sachs Global Investment Research

ISABELNET Cartoon of the Day

ISABELNET Cartoon of the Day Bears hate a strong January, which is widely seen as a bullish sign for stocks. Historically, when the S&P 500 rises in January, it tends to be a reliable predictor of positive returns for the entire year. Happy Friday, Everyone! 😎

S&P 500 vs. Forward Earnings Estimates

S&P 500 vs. Forward Earnings Estimates While the outlook for corporate earnings in 2025 remains positive, the elevated market valuations mean that companies will need to deliver on these high expectations to sustain the bull market. Image: Yahoo Finance

Cyclicals vs. Defensives Performance

Cyclicals vs. Defensives Performance Cyclical sectors’ strong performance suggests economic optimism, but investors must be cautious about potential overvaluation and risks, especially when buying cyclical stocks late in the economic cycle. Image: Goldman Sachs Global Investment Research

Nominal S&P 500 Earnings Growth – Nominal GDP Growth

Nominal S&P 500 Earnings Growth – Nominal GDP Growth The rapid acceleration of U.S. corporate earnings growth over the past three decades, which has outpaced the broader U.S. economy, is a key factor behind today’s high market valuations—a trend that may persist. Image: Deutsche Bank

S&P 500 Index Returns Based on if January is Higher or Lower

S&P 500 Index Returns Based on if January is Higher or Lower Bulls have reason to smile, as a strong January is often seen as a bullish sign for the stock market. Historically, a higher S&P 500 in January has been associated with positive full-year returns. Image: Carson Investment Research