Correlation Between Top 10 and S&P 500

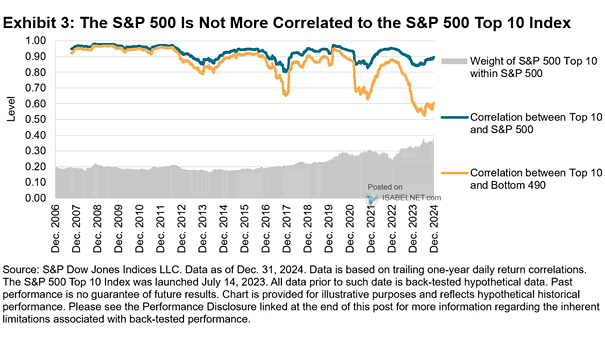
Correlation Between Top 10 and S&P 500 While the concentration of large-cap stocks in the U.S. equity market is a topic of discussion, the evidence suggests that its impact on market behavior is not as alarming as some might believe. Image: S&P Dow Jones Indices
S&P 500 Around Close Presidential Elections

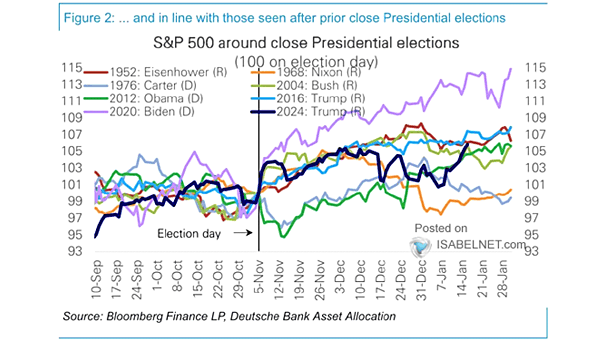
S&P 500 Around Close Presidential Elections The cyclical nature of equity markets around U.S. elections often leads to rallies after the election as policy uncertainties fade. Image: Deutsche Bank Asset Allocation

S&P 500 Annual Performance Based On What The First Five Days Do

S&P 500 Annual Performance Based On What The First Five Days Do A bullish start to the year for the S&P 500 is often seen as a good omen. When the index rises in the first five trading days, it has historically led to stronger annual returns, averaging 14.2% and being positive 81.3% of the…

S&P 500 Performance per Year of a 4-Year Presidential Cycle

S&P 500 Performance per Year of a 4-Year Presidential Cycle The U.S. stock market typically outperforms in the first two years of a President’s second term compared to a new President’s term, suggesting a potentially strong year for stocks and giving bulls reason to smile. Image: Carson Investment Research

S&P 500 Valuation – Shiller P/E Ratio at the Start of Presidency

S&P 500 Valuation – Shiller’s Cyclically-Adjusted Price-To-Earnings (CAPE) Ratio With the Shiller P/E ratio indicating an unusually high valuation for the U.S. stock market compared to the start of previous presidential terms, investors may need to moderate their expectations for future returns. Image: The Wall Street Journal

ISABELNET Cartoon of the Day

ISABELNET Cartoon of the Day The S&P 500 rose 1.74% this week, maintaining its positive trajectory for January and giving bulls a reason to throw a party, while bears are contemplating a career change to avoid the market madness! Have a Great Weekend, Everyone! 😎

Euro to U.S. Dollar (EUR/USD)

Euro to U.S. Dollar (EUR/USD) The euro has shown strength this week, but caution is warranted. Potential shifts in U.S. trade policy under Trump and ongoing economic disparities continue to give the dollar an edge. Image: Bloomberg

NFIB Small Business Confidence Index

NFIB Small Business Confidence Index In December 2024, the NFIB Small Business Optimism Index soared to 105.1, a six-year high, as small business owners’ confidence surged following the recent election and expectations of pro-business policies. Image: Real Investment Advice

S&P 500 Earnings and Gross Buybacks

S&P 500 Earnings and Gross Buybacks With U.S. corporate earnings on the rise, share buybacks in 2025 are expected to exceed $1 trillion. Image: Deutsche Bank Asset Allocation

ISABELNET Cartoon of the Day

ISABELNET Cartoon of the Day Wall Street’s optimism is so high that even gravity seems bullish. As a result, bears are experiencing altitude sickness from the market’s rapid rise! Have a Great Day, Everyone! 😎

Average Probability S&P 500 Volatility Regime

Average Probability S&P 500 Volatility Regime The probability of a high S&P 500 volatility regime has increased, suggesting that elevated volatility could persist throughout 2025. Image: Goldman Sachs Global Investment Research