S&P 500 Index Single Day Average Returns
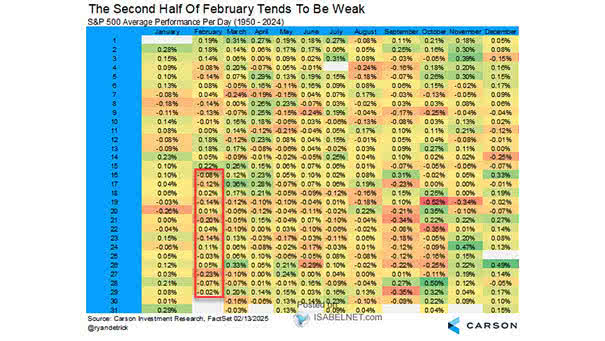
S&P 500 Index Single Day Average Returns Saint Patrick’s Day is putting a smile on the bulls, as it’s not just one of the greenest days of the year but also historically the strongest for U.S. stocks in March, leaving bears short on luck. Happy Saint Patrick’s Day! 🍀☘ Image: Carson Investment Research