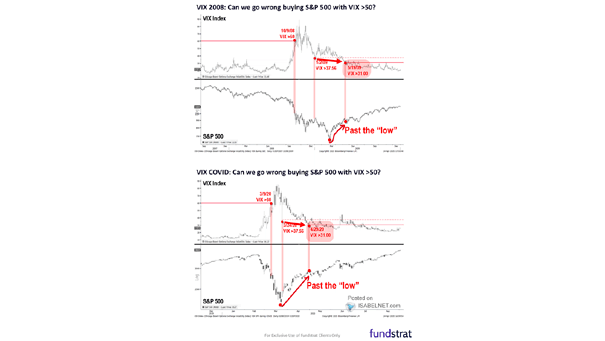
U.S. Equity ETF Flows

U.S. Equity ETF Flows Inflows to U.S. equity ETFs as a percentage of S&P 500 market cap have reached elevated levels, reflecting strong investor confidence in U.S. equities. Image: J.P. Morgan Positioning Intelligence

Federal Debt Outstanding % GDP and Federal Interest Payments % GDP

Federal Debt Outstanding % GDP and Federal Interest Payments % GDP Recent interest rate cuts are easing federal interest expenses but raise concerns about long-term fiscal sustainability, as interest payments are expected to increase significantly in the future. Image: TS Lombard

ISABELNET Cartoon of the Day

ISABELNET Cartoon of the Day While bulls have faced significant challenges this week due to limited rate cuts in 2025 and market volatility, bears are finding reasons to be optimistic about potential corrections in the near future. Happy Friday, Everyone! 😎

U.S. Money Market Funds

U.S. Money Market Funds Following the Fed’s first rate cut, U.S. money market funds typically experience outflows within 12 months as investors rebalance portfolios and reassess risk in response to changing interest rates and market conditions. Image: Federal Reserve Bank of St. Louis

Bitcoin Annual Returns

Bitcoin Annual Returns Over the past few years, Bitcoin has demonstrated a trend of three years of rising prices, followed by a significant decline in the fourth year. Can we expect this trend to continue in 2025? Image: Carson Investment Research

S&P 500 Valuations

S&P 500 Valuations According to a macro model developed by Goldman Sachs, U.S. equities are suggested to be overvalued by more than 40%, raising concerns among market participants about long-term sustainability and future market corrections. Image: Goldman Sachs Global Investment Research

Implied Fed Funds Target Rate

Implied Fed Funds Target Rate The Fed has revised its 2025 projections, now anticipating only two rate cuts instead of four, with future reductions dependent on the progress made in managing inflation. Image: Bloomberg

ISABELNET Cartoon of the Day

ISABELNET Cartoon of the Day With Bitcoin surpassing $100,000, bears are now on dating apps looking for a bull! Have a Great Day, Everyone! 😎

U.S. ISM Manufacturing Index vs. S&P 500 EPS Annual % Change

U.S. ISM Manufacturing Index vs. S&P 500 EPS Annual % Change With the ISM Manufacturing Index still in contraction territory and strongly correlated with S&P 500 earnings growth, questions arise about the resilience of corporate earnings in 2025. Image: Real Investment Advice

S&P 500 Performance After Fed Cuts Within 2% of All-Time Highs

S&P 500 Performance After Fed Cuts Within 2% of All-Time Highs Bulls rejoice! Since 1980, when the S&P 500 was within 2% of its all-time high during a Fed rate cut, it has been positive 100% of the time over the following 12 months, with an average gain of 13.9%. Image: Carson Investment Research

S&P 500 2025 Year-End Target

S&P 500 2025 Year-End Target While most strategists project a bullish 2025 for the S&P 500, a notable minority advocates for caution. This divergence in opinion could comfort investors wary of market euphoria. Image: BCA Research