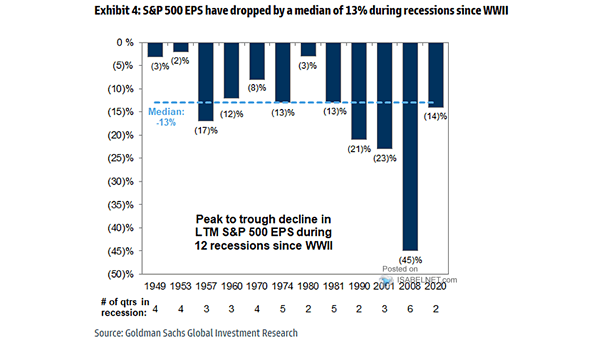
ISABELNET Cartoon of the Day

ISABELNET Cartoon of the Day The “Liberation Day” effect has set equity markets free—free to plummet, that is! Have a Great Week, Everyone! 😎

Impact on U.S. YoY Real GDP Growth

Impact on U.S. YoY Real GDP Growth Goldman Sachs has cut its 2025 Q4/Q4 GDP growth forecast to 0.5% and raised its 12-month recession probability from 35% to 45%, citing tighter financial conditions, foreign consumer boycotts, and heightened policy uncertainty. Image: Goldman Sachs Global Investment Research

Large U.S. Tax Hikes

Large U.S. Tax Hikes Trump’s tariffs represent the most significant U.S. tax increase since 1968, raising widespread concerns about their long-term effects on the economy. Image: J.P. Morgan

ISABELNET Cartoon of the Day

ISABELNET Cartoon of the Day As the S&P 500 tumbles 9.08% this week, bears are popping champagne, and bulls are asking, “Is there even a floor anymore?” Have a Great Weekend, Everyone! 😎

ISABELNET Cartoon of the Day

ISABELNET Cartoon of the Day As bears heard Trump’s tariffs were going to cause a bear market, bulls suddenly came down with a case of stagflation! Happy Friday, Everyone! 😎

EPS Revisions

EPS Revisions Typically, positive revisions in EPS increase stock market value and attract more investors, while negative revisions usually apply downward pressure on stock prices. Image: Goldman Sachs Global Investment Research

VIX Futures Curve

VIX Futures Curve Market participants are anticipating a potential decline in volatility, reflecting hopes for reduced uncertainty and stabilization of trade-related concerns impacting markets. Image: The Daily Shot

NBER Recession Dating vs. Market Realization

NBER Recession Dating vs. Market Realization Historically, the S&P 500 peaks and declines 6–16 months before the National Bureau of Economic Research (NBER) officially declares a U.S. recession, making it a reliable leading indicator. Image: Real Investment Advice

Average Daily Equity ETF Flow vs. S&P 500 Performance

Average Daily Equity ETF Flow vs. S&P 500 Performance Despite the S&P 500’s decline in Q1 2025, investors continued pouring money into equity ETFs, averaging nearly $3bn daily inflows—a sign of persistent appetite for U.S. equities amid volatility. Image: Strategas Research Partners

Largest Calendar Year Peak to Trough S&P 500 Drawdown

Largest Calendar Year Peak to Trough S&P 500 Drawdown The S&P 500 has shown resilience over extended periods, often delivering positive annual returns despite experiencing significant intra-year volatility. Over the past 40 years, the median annual drawdown of the index has been 10%. Image: Goldman Sachs Global Investment Research