ISABELNET Cartoon of the Day
ISABELNET Cartoon of the Day Are tariffs the bears’ secret weapon? While bulls struggle with market volatility, bears may capitalize on the economic chaos triggered by trade barriers! Have a Great Day, Everyone! 😎
ISABELNET Cartoon of the Day Are tariffs the bears’ secret weapon? While bulls struggle with market volatility, bears may capitalize on the economic chaos triggered by trade barriers! Have a Great Day, Everyone! 😎
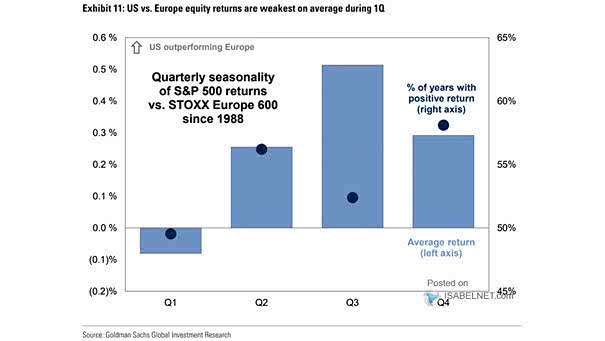
Quarterly Seasonality of S&P 500 Returns vs. STOXX Europe 600 U.S. equity returns tend to be strongest relative to Europe during the second quarter. Image: Goldman Sachs Global Investment Research
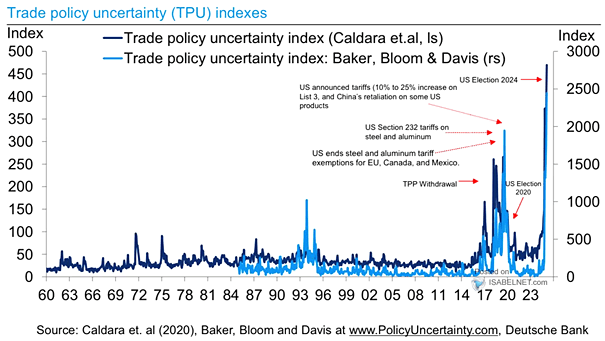
Trade Policy Uncertainty Indexes Uncertainty in trade policy often leads to positive future returns for the S&P 500, as markets tend to price in worst-case scenarios during unclear times. Once clarity emerges, stocks frequently recover. Image: Deutsche Bank
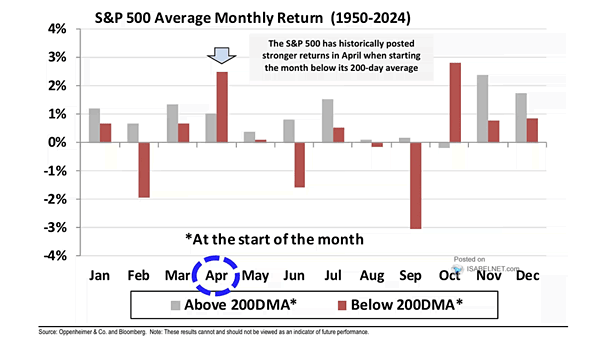
S&P 500 Average Monthly Return Above and Below 200-Day Moving Average Historically, the S&P 500 has performed well in April, averaging gains of over 2% since 1950 when starting below its 200-day moving average. Image: Oppenheimer & Co. Inc. and Bloomberg

ISABELNET Cartoon of the Day It’s tariff day, and traders are as excited as shoppers on Black Friday—except everything is now on sale for double the price! Happy “Hump” Day, Everyone! 🐫🐪😎
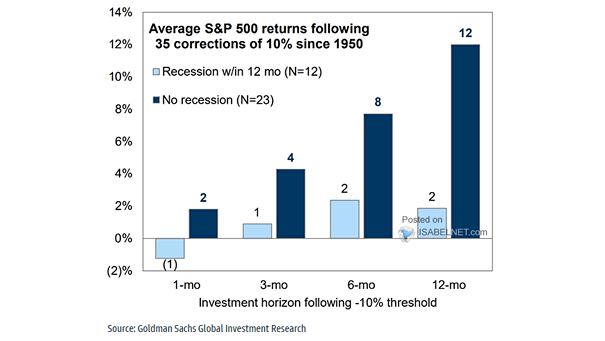
Average S&P 500 Returns Following 35 Corrections of 10% Since 1950 Market corrections of 10% in the S&P 500 are a normal aspect of market cycles, often presenting long-term investors with attractive buying opportunities, especially in the absence of a recession. Image: Goldman Sachs Global Investment Research
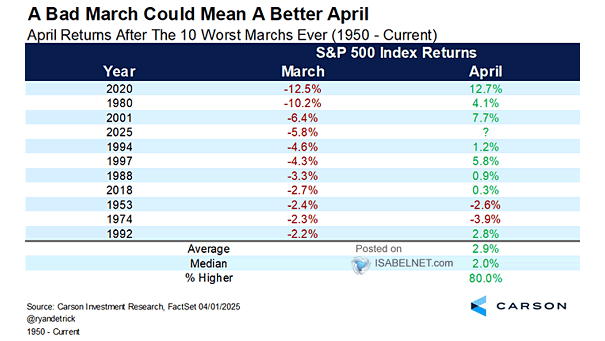
April Returns After the 10 Worst Marchs Ever for the S&P 500 Index Historical data since 1950 shows that following the 10 worst March performances, the S&P 500 index has averaged a 2.9% return in April, with positive returns occurring 80% of the time, giving bulls reason to smile! Image: Carson Investment Research
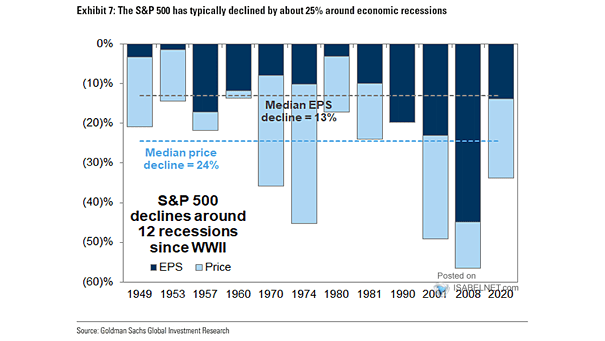
S&P 500 Index Declines Around Recessions Historically, the S&P 500 has fallen by a median 24% from peak-to-trough around economic recessions. Image: Goldman Sachs Global Investment Research

ISABELNET Cartoon of the Day Greenland is not on the market; it’s a country with its own people and culture, not a frozen real estate deal! Happy April Fool’s Day, Everyone! 😎
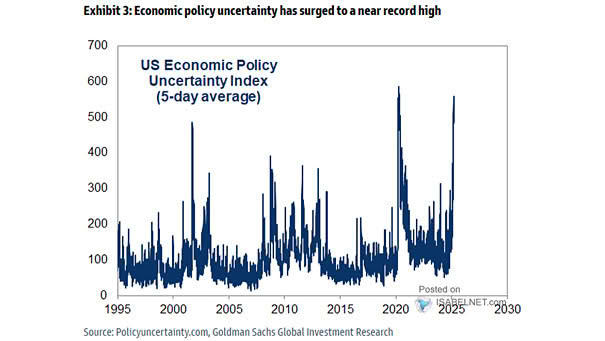
U.S. Economic Policy Uncertainty Index Uncertainty in economic policy has often led to positive future returns for the S&P 500, as markets anticipate the worst during unclear periods. When the situation becomes clearer, stocks tend to recover strongly. Image: Goldman Sachs Global Investment Research

ISABELNET Cartoon of the Day As the S&P 500 nosedives, bears see disaster looming, while bulls see an opportunity so bright they might need sunglasses. Who knew optimism and pessimism could be so hilarious? Have a Great Week, Everyone! 😎