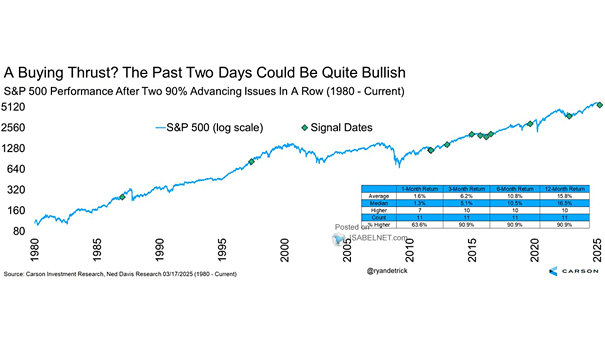
S&P 500 Performance After Two 90% Advancing Issues in a Row
S&P 500 Performance After Two 90% Advancing Issues in a Row Since 1980, two consecutive days with 90% advancing issues in the S&P 500 have delivered a median return of 16.5% over the following 12 months, with positive returns occurring 90.9% of the time—giving bulls reason to rejoice! Image: Carson Investment Research