ISABELNET Cartoon of the Day
ISABELNET Cartoon of the Day The S&P 500 took a dive last week with a 1.94% loss. It seems bulls are feeling a bit under the weather—maybe too much partying at market highs! Have a…
ISABELNET Cartoon of the Day The S&P 500 took a dive last week with a 1.94% loss. It seems bulls are feeling a bit under the weather—maybe too much partying at market highs! Have a…
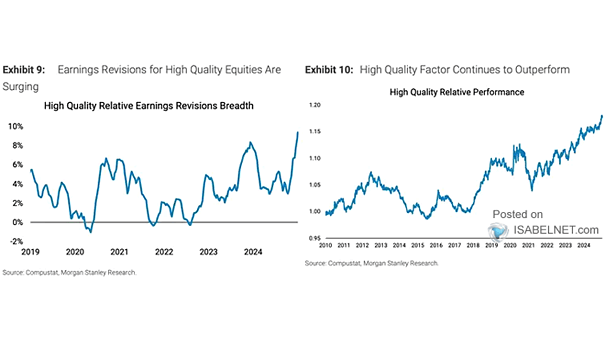
Stocks – High Quality Relative Earnings Revisions Breadth and High Quality Factor Relative Performance In a late-cycle market, investors looking for stability might find high-quality stocks appealing, given their historical ability to provide robust protection…
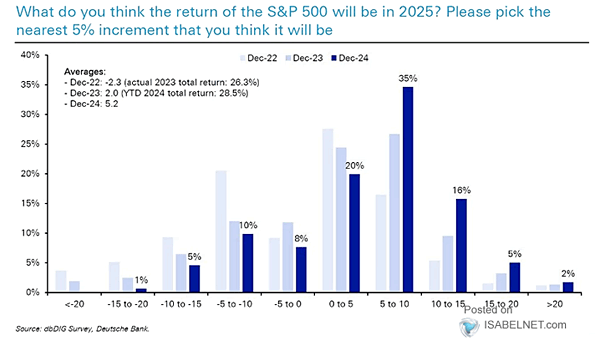
How Survey Responders Think the S&P 500 Will Perform Over the Year Ahead 35% of respondents expect the S&P 500 index to appreciate between 5% and 10% by the end of 2025, while 24% expect…
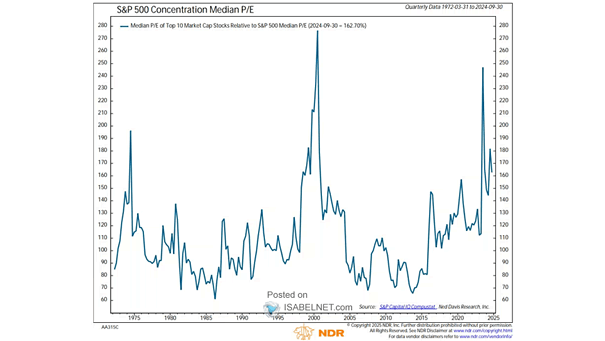
Valuation – S&P 500 Concentration Median P/E While the current median P/E of the top 10 stocks relative to the S&P 500 median P/E is historically high, it is still below the peaks seen during…

ISABELNET Cartoon of the Day Bears hate that the S&P 500 has a history of strong performance following years of double-digit gains, when the first five trading days of the new year show positive results.…
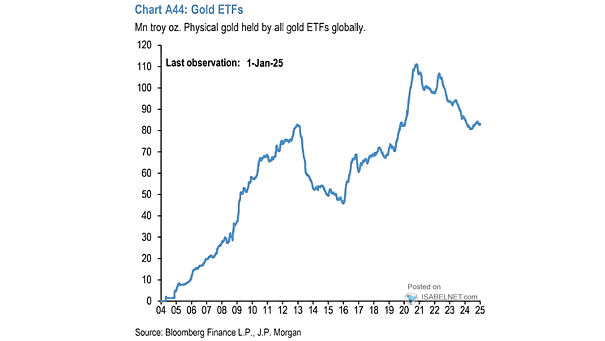
Physical Gold Held by all Gold ETFs Globally While central banks are increasing their gold reserves as a hedge against economic uncertainty and currency risks, global gold ETFs continue to see a decline in investor…
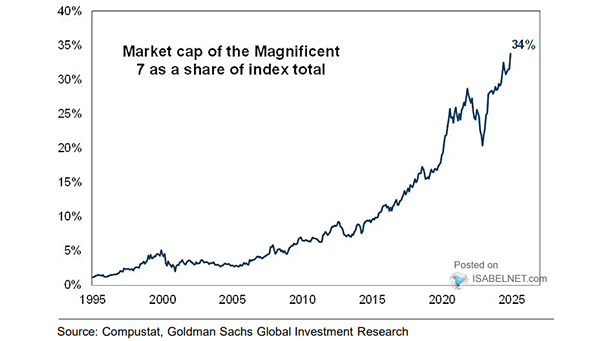
U.S. Stocks – Magnificent Seven Market Value as a Percent of S&P 500 Market Value The “Magnificent Seven” stocks have significantly influenced the S&P 500, now accounting for 34% of its market capitalization, reflecting their…
ISABELNET Cartoon of the Day Bears are struggling to find U.S. stocks that don’t make them feel like they’re overpaying—similar to buying a used car at full price from a salesman who claims it was…
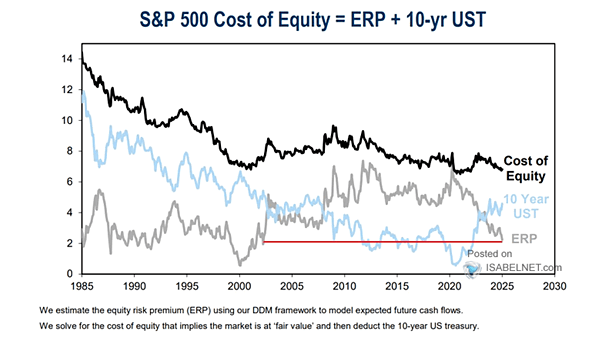
S&P 500 Equity Risk Premium With the S&P 500 equity risk premium hitting multi-decade lows, investors may find bonds more appealing than stocks. Image: Goldman Sachs Global Investment Research
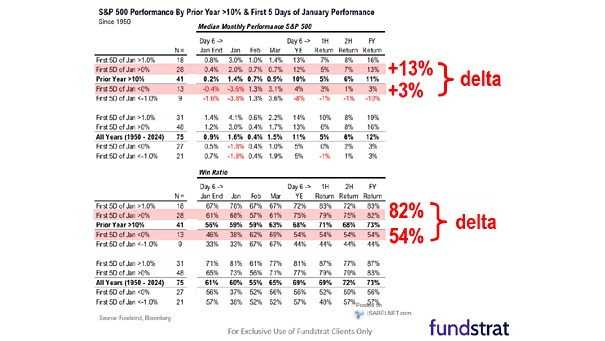
S&P 500 Performance by Prior Year >10% and First 5 Days of January Performance The S&P 500 has historically shown strong performance following years of double-digit gains, when the first five trading days of the…

ISABELNET Cartoon of the Day Even in a bull market, where the S&P 500 gained 0.55% yesterday, it seems bears have opted for a long vacation rather than hibernation! Have a Great Day, Everyone! 😎