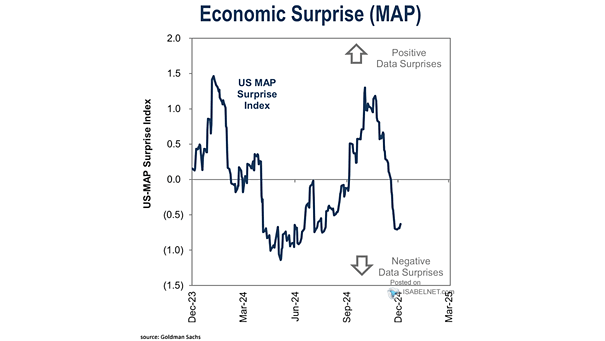
U.S. Small Cap Fund Flows
U.S. Small Cap Fund Flows The recent surge in inflows to U.S. small-cap funds highlights a favorable outlook on small-cap stocks as an investment option, as investors appear to be reallocating some of their assets…
Performance – U.S. vs. Global ex-U.S. Given that U.S. equities are at record highs compared to global stocks, should long-term investors consider reallocating a larger portion of their portfolios to global ex-U.S. stocks instead of…
Inflation – U.S. Core PCE and Core CPI Goldman Sachs’ forecast of a continuous decline in U.S. core PCE and core CPI suggests a potential slowdown in inflationary pressures, which could have significant implications for…
How the S&P 500 Does in an Election Year If the President Is Up for Re-Election or Not Historically, U.S. stocks tend to perform well in election years when the incumbent president is running for…
Rolling 24 Month Correlation Between U.S. Treasury Bonds and Equities Amid high inflation, UST bonds become less effective as a hedge against U.S. stocks, as rising prices erode bond payouts and interest rate hikes lead…
S&P 500 and New 52-Week Highs and New 52-Week Lows The improvement in the percentage of S&P 500 stocks at new 52-week highs can be seen as a confirmation of a cyclical bull market. This…
U.S. Value Flows Over the past 18 months, outflows from U.S. value funds have been substantial, totaling a record $100 billion. Image: BofA Global Investment Strategy
NAAIM vs. S&P 500 Index Active investment managers, with their portfolios fully invested in equities, are often criticized for their consistent habit of selling at market bottoms and purchasing at market tops. Image: Real Investment…
S&P 500 Index Returns in July Historically, July has shown strong performance in the U.S. stock market during its first half. The market often peaks on July 17, as investors take profits before the traditional…
Secular Bull Market – S&P 500 Weekly Chart with the 40-Week MA and 200-Week MA The S&P 500 has reached the 5600s target based on the bullish cup and handle pattern that formed in 2022-2023.…
Performance – Large Cap vs. Small Cap The durability of the rotation from U.S. large caps to U.S. small caps remains to be seen as the market assesses the implications of changing inflation and rate…