S&P 500 Performance vs. Forward EPS
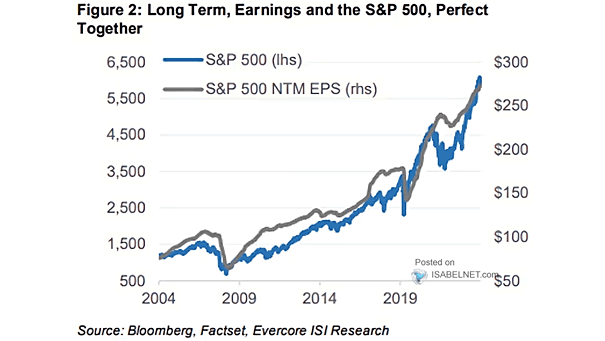
S&P 500 Performance vs. Forward EPS While long-term earnings are essential for driving stock prices over time, the influence of rising long-term yields cannot be overlooked. Image: Evercore ISI
S&P 500 Performance vs. Forward EPS While long-term earnings are essential for driving stock prices over time, the influence of rising long-term yields cannot be overlooked. Image: Evercore ISI
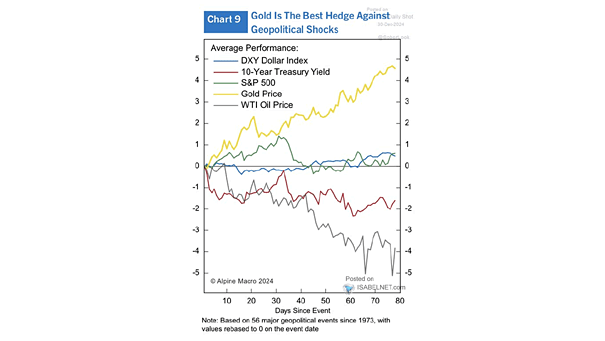
Average Performance on Major Geopolitical Events Investors regard gold as both a hedge against inflation and a strategic asset during geopolitical uncertainty, having proven to be the most effective safeguard against major geopolitical events since…
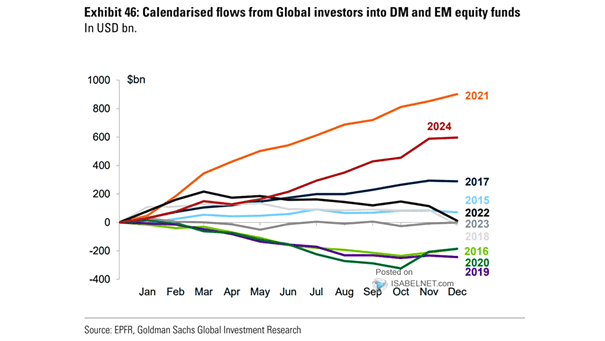
Cumulative Flows from Global Investors into DM and EM funds In 2024, equity funds in developed and emerging markets have experienced substantial inflows from global investors, reflecting a resurgence of confidence in the market. Image:…

ISABELNET Cartoon of the Day While bears are busy counting their losses, those who dared to ride the S&P 500 wave are enjoying a hefty 26.9% return YTD, including dividends! It’s safe to say that…
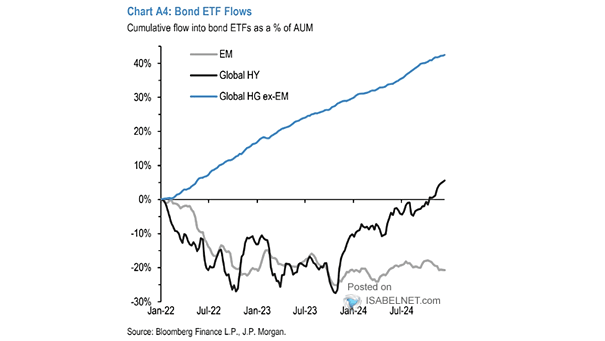
Bonds Flows Since January 2024, there has been a notable trend of strong inflows into bond ETFs, particularly high-yield bonds, driven by favorable yield conditions and an overall “risk-on” sentiment in the market. Image: J.P.…
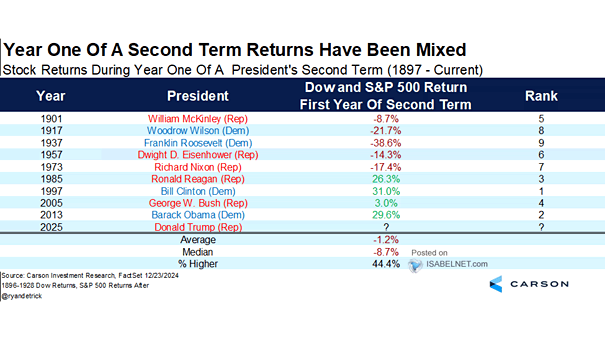
U.S. Stocks Returns during Year One of a President’s Second Term The performance of U.S. stocks during the first year of a second presidential term has shown mixed results historically, but recent trends suggest a…
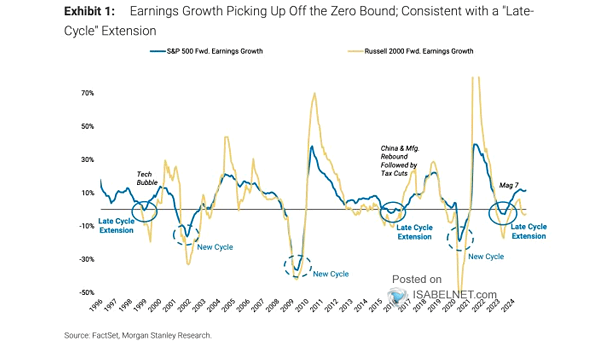
S&P 500 Fwd. Earnings Growth and Russell 2000 Fwd. Earnings Growth The recovery in EPS growth has been driven by a small number of large-cap companies, which may indicate a late-cycle extension in the economic…
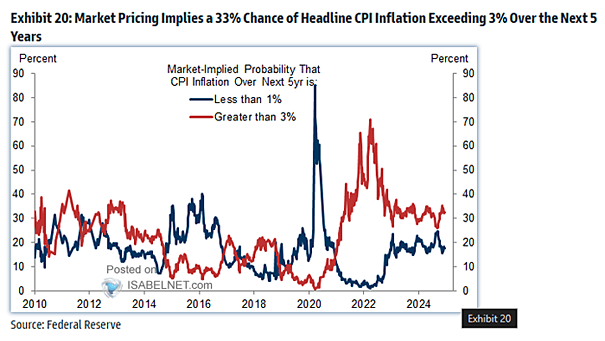
Market-Implied Probability of U.S. CPI Inflation Over the Next 5 Years Market pricing indicates a substantial likelihood that future U.S. headline CPI inflation rates will exceed 3%, with a 33% probability over the next five…
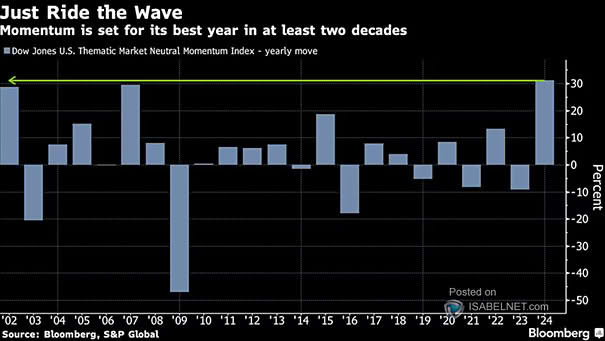
Return – Dow Jones U.S. Thematic Market Neutral Momentum Index With a remarkable 31% return in 2024, momentum investing has emerged as a standout equity strategy, poised for its best year since 2002. Image: Bloomberg
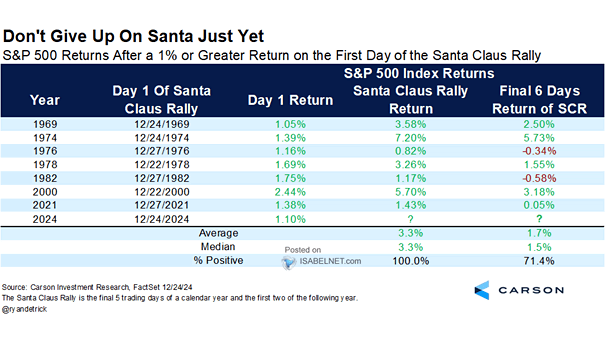
S&P 500 Returns After a 1% or Greater Return on the First Day of the Santa Claus Rally Bulls are excited! Since 1969, each time the S&P 500 has gained 1% or more on the…
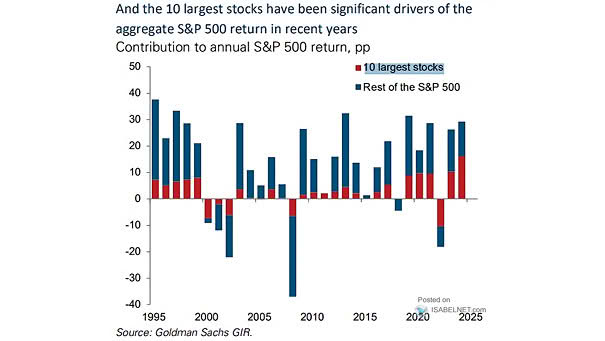
Contribution to Annual S&P 500 Return The ten largest stocks in the S&P 500 have significantly influenced its performance in recent years, driving returns while raising important questions about the risks associated with market concentration.…