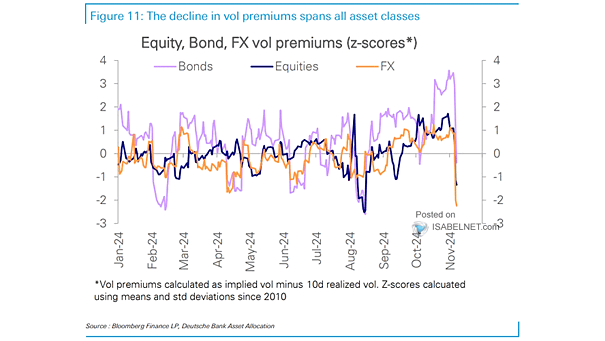
Equity, Bond, FX and Oil Volatility Premiums
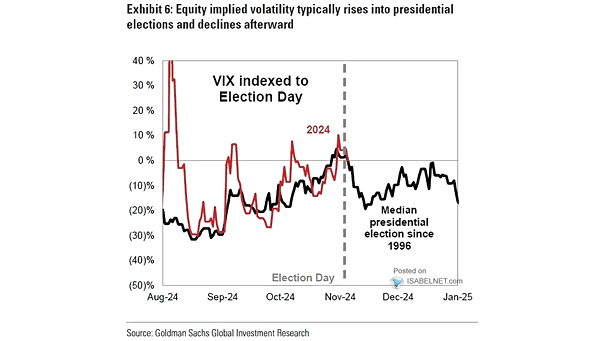
Equity, Bond, FX and Oil Volatility Premiums Volatility premiums have significantly declined across asset classes after the U.S. elections. As election results become known, market uncertainty diminishes, leading to lower volatility premiums and increased stability.…