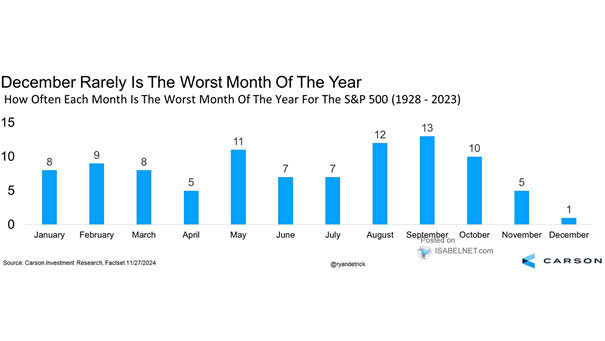
How Often is the Worst Month of the Year for the S&P 500
How Often is the Worst Month of the Year for the S&P 500 Bulls are smiling, probably because they’ve just realized that December being the worst month of the year is as rare as finding…
How Often is the Worst Month of the Year for the S&P 500 Bulls are smiling, probably because they’ve just realized that December being the worst month of the year is as rare as finding…
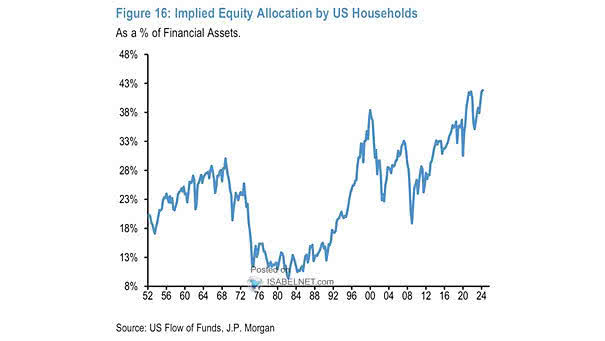
Implied Equity Allocation by U.S. Households Periods of high household equity allocation have historically been followed by lower market returns, implying that current trends might indicate potential risks for future investors. Image: J.P. Morgan
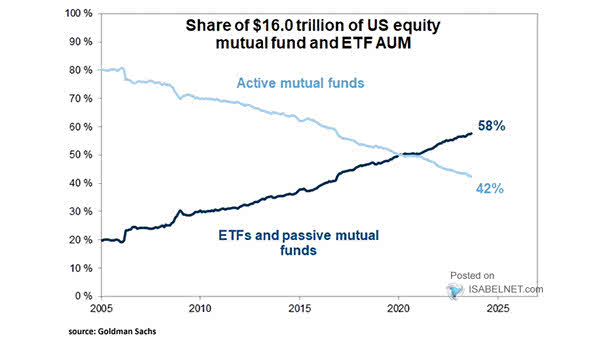
Share of U.S. Equity Mutual Fund and ETF AUM Passive U.S. equity funds surpassed active ones in 2020. Investors prefer them due to their lower fees, potential tax benefits, and the belief that active fund…
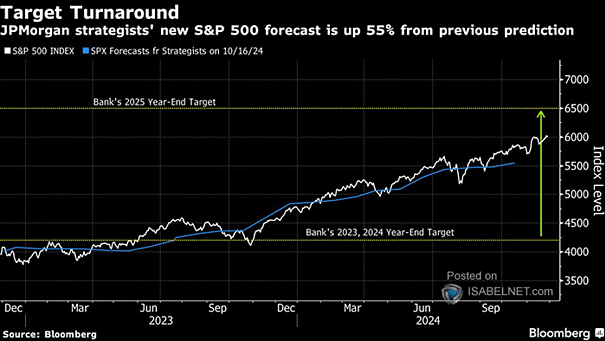
S&P 500 Price Forecast JPMorgan has shifted to a bullish outlook on U.S. stocks, setting a 2025 year-end S&P 500 target of 6,500, driven by U.S. economic strength, AI sector growth, a robust labor market,…
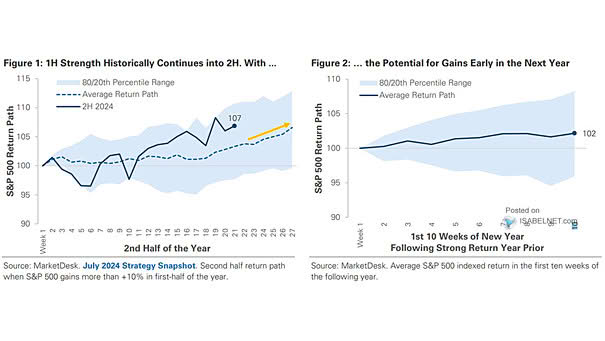
Path of the S&P 500 Based on historical trends, strong performance by the S&P 500 in the first half of the year typically results in continued gains during the second half, which may indicate potential…
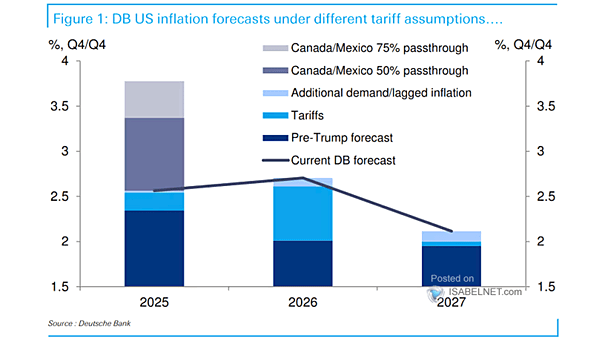
Inflation Forecasts If Trump implements a 25% tariff on imports from Canada and Mexico, along with a 10% tariff on imports from China, it could push U.S. core PCE inflation above 3% in 2025. Image:…

ISABELNET Cartoon of the Day Searching for a duct-taped banana at a steal of less than $6,240,000? Well, you’re in luck—Black Friday has gone bananas with discounts reaching 99% off! Happy Black Friday, Everyone! 😎

Indexed Return of Cyclicals vs. Defensives ex. Commodities and ISM Manufacturing Index U.S. equity sector rotations are pricing in a “no landing” economic scenario, where the U.S. economy avoids both recession and significant slowdown, maintaining…
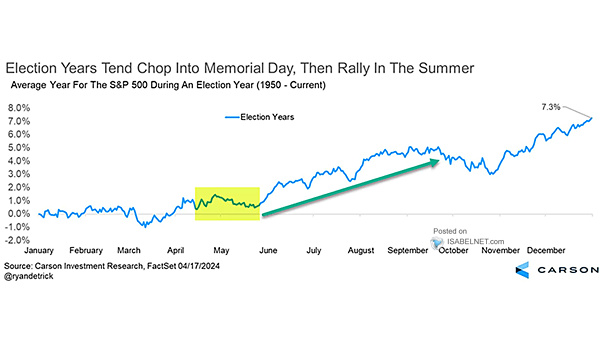
S&P 500 Performance in Election Years Bulls are smiling as December is one of the most promising months for U.S. stocks during a presidential election year, with gains occurring 83.3% of the time and an…
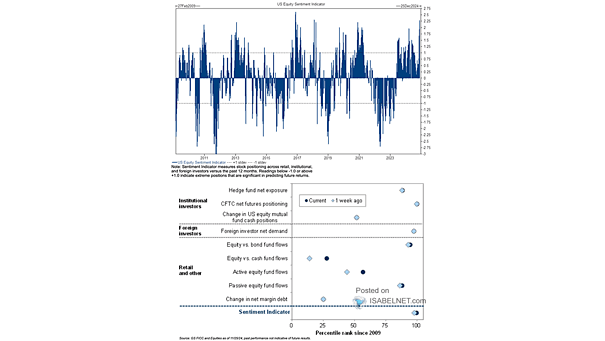
U.S. Equity Sentiment Indicator With the year-end approaching, sentiment is overly stretched, implying that market participants might be excessively optimistic and overconfident in their bullish outlook. Image: Goldman Sachs Global Investment Research

ISABELNET Cartoon of the Day Historically, inverted yield curves have accurately predicted U.S. recessions, making them a crucial economic indicator. However, this time may be different, regardless of what bears claim. Have a Great Day,…