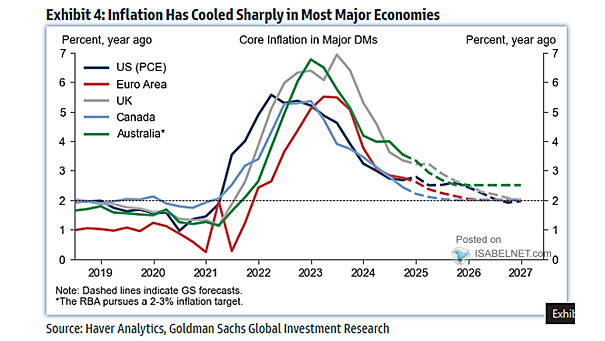
Cumulative Flows to Crytocurrency Funds

Cumulative Flows to Crytocurrency Funds In 2024, unprecedented inflows into cryptocurrency funds signal a shift in sentiment, as both retail and institutional investors increasingly embrace digital assets. Image: Deutsche Bank Asset Allocation

U.S. Government Spending

U.S. Government Spending U.S. government spending fell by 6% year-over-year, marking a notable shift. Image: BofA Global Investment Strategy

S&P 500 – Indexed Performance

S&P 500 – Indexed Performance Until the summer, the S&P 500 achieved one of its best starts in history, closely following the trajectory of 1995. During that year, the Fed cut interest rates, marking the…

Pullbacks on the S&P 500

Pullbacks on the S&P 500 While 5% pullbacks can be unsettling, they are a normal part of the market cycle and often present good entry points for traders and investors to add exposure during a…

S&P 500 and Pullbacks

S&P 500 and Pullbacks While pullbacks can be challenging, historical data indicates that the S&P 500 tends to recover and move higher in the months following a 5% pullback. Image: Goldman Sachs Global Investment Research

S&P 500 Earnings vs. CPI and PPI

S&P 500 Earnings vs. CPI and PPI While inflation can influence S&P 500 earnings, it is commonly seen as a lagging indicator rather than a leading one. Image: BofA US Equity & Quant Strategy

S&P 500 and 3-Month VIX Relative to VIX (VIX3M/VIX)

S&P 500 and 3-Month VIX Relative to VIX (VIX3M/VIX) The 3-month VIX relative to the VIX closing at an oversold level below 1 is a potentially significant indicator of market sentiment. This can be interpreted…

Seasonality of Market Performance – MSCI USA

Seasonality of Market Performance – MSCI USA August and September have historically been less favorable months for U.S. equities, with lower average performance compared to other months. Image: BofA Global Quantitative Strategy

Average Monthly Volatility for U.S. Election Years Since 1928

Average Monthly Volatility for U.S. Election Years Since 1928 The historical pattern of the VIX rising before U.S. elections and then rapidly plunging afterward is attributed to increased uncertainty and investor fear leading up to…

ISM Manufacturing PMI and U.S. Recessions

ISM Manufacturing PMI and U.S. Recessions A drop in the U.S. ISM Manufacturing PMI below 45 signals significantly heightened recession risks, indicating a severe contraction in the manufacturing sector. Image: BofA Global Research

VIX Average Trend in U.S. Election Years

VIX Average Trend in U.S. Election Years Historical patterns suggest that the VIX tends to bottom out in mid to late August, followed by a trend of increasing volatility as the U.S. Election Day approaches,…