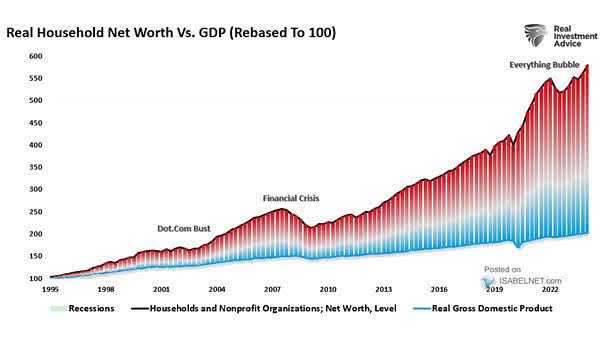
Asset Classes – Valuation vs. History

Asset Classes – Valuation vs. History The current market environment reflects a contrast between relatively cheap commodities and expensive U.S. stock valuations. Image: Topdown Charts

Cumulative Annual Flows to IG Bond Funds

Cumulative Annual Flows to IG Bond Funds Investment-Grade (IG) corporate bond funds have experienced a surge in investor interest and confidence this year, resulting in robust inflows into this asset class. Image: BofA Global Investment…

Annual Equities Fund Flows

Annual Equities Fund Flows Investor appetite for equity funds remains strong, driven by optimism about potential returns and long-term growth prospects. Image: BofA Global Investment Strategy

Money Market Flows

Money Market Fund Flows While the U.S. equity market has been steadily rising since its 2022 low, conservative investors maintain a strong inclination towards holding cash. Image: BofA Global Investment Strategy

Mutual Fund and ETF In/(Out)Flows

Mutual Fund and ETF In/(Out)Flows Since 2023, cash has emerged as the flow winner. Will it serve as the primary driving force behind the bull markets in the months ahead? Image: Goldman Sachs Global Investment…

U.S. Dollar vs. S&P 500

U.S. Dollar vs. S&P 500 The market is responding positively to good news, as indicated by the recent divergence between the S&P 500 and the U.S. dollar (inverted). This suggests a renewed sense of optimism…

EM Debt Flows

EM Debt Flows Outflows from emerging market debt persist, indicating a sustained trend of movement away from this financial asset. Image: BofA Global Investment Strategy

Valuation – Equal-Weight S&P 500 P/E Multiple

Valuation – Equal-Weight S&P 500 P/E Multiple According to Goldman Sachs, the equal-weight S&P 500 P/E multiple is currently 13% above fair value. This suggests that stocks in the S&P 500 Equal Weight Index may…

S&P 500 Equity Risk Premium

S&P 500 Equity Risk Premium Despite potential in U.S. equities, the decline in equity risk premium suggests caution is needed, prompting diversification across asset classes for risk management. Image: BofA Global Research

Stocks – Indexed Consensus NTM Net Income

Stocks – Indexed Consensus NTM Net Income The widening gap in expected net income between mega-cap tech stocks and the bottom 493 stocks of the S&P 500 highlights the concentration risk and volatility associated with…