S&P 500 Advance-Decline Line
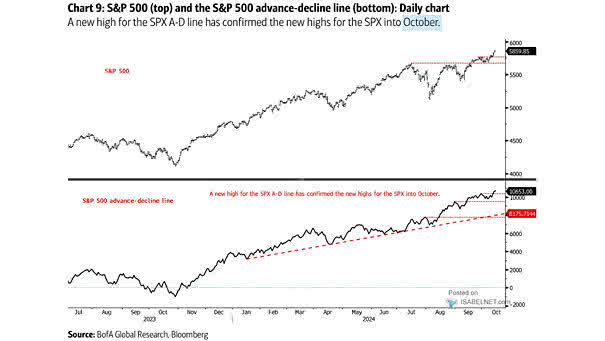
S&P 500 Advance-Decline Line The S&P 500 advance-decline line serves as an essential indicator of market trends and sentiment. When it hits an all-time high, it typically signals positive news for the U.S. stock market.…
S&P 500 Advance-Decline Line The S&P 500 advance-decline line serves as an essential indicator of market trends and sentiment. When it hits an all-time high, it typically signals positive news for the U.S. stock market.…
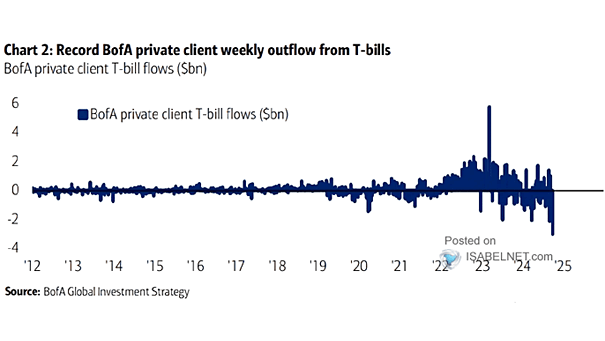
GWIM T-Bill Flows In light of the Fed’s recent rate cuts, BofA’s private clients are actively selling T-bills and strategically positioning themselves for potential gains in other asset classes. Image: BofA Global Investment Strategy
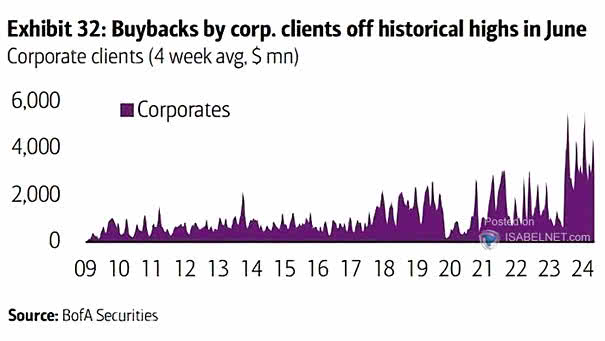
Corporate Clients – Buybacks (4-Week Average) Strong buyback activity from BofA’s corporate clients, exceeding historical averages, is a positive sign for investors, reflecting confidence in future growth prospects. Image: BofA Securities
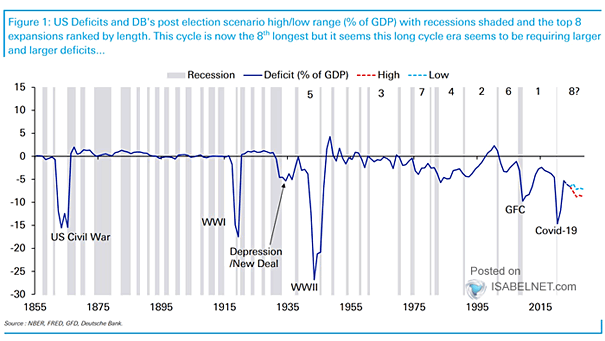
U.S. Deficits While higher deficits can stimulate economic growth and extend business cycles through increased government spending and investment, they also pose significant risks to long-term economic stability. Image: Deutsche Bank
FMS Investors – Average Percentile Rank of Growth Expectations, Cash Allocation, Equity Allocation The decline in pessimism among FMS investors is viewed as a positive indicator, suggesting a growing willingness to embrace risk. Image: BofA…
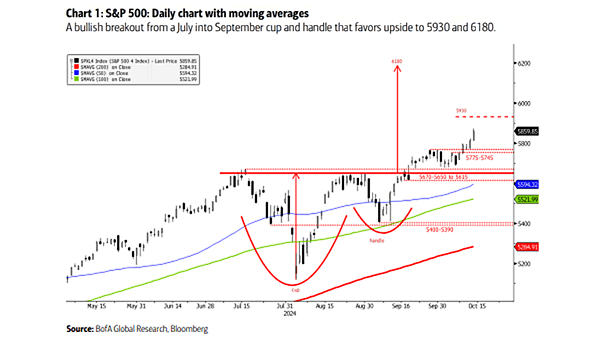
S&P 500 Daily Chart The cup and handle breakout suggests a bullish trend, implying that the S&P 500 index could experience upward movement, with target levels of 5930 and 6180. Image: BofA Global Research
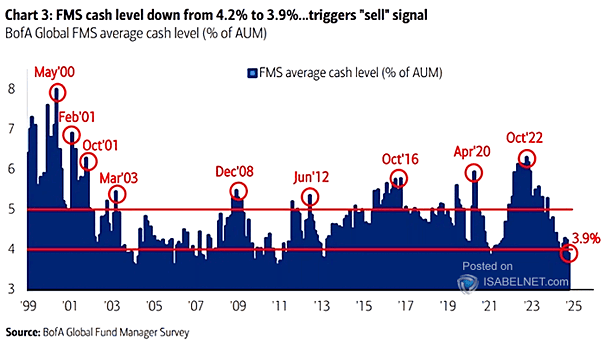
FMS Average Cash Balance The FMS cash level’s recent decline to 3.9% has generated a contrarian sell signal for global equities. Historically, these signals often precede market corrections, prompting investors to reassess their strategies. Image:…
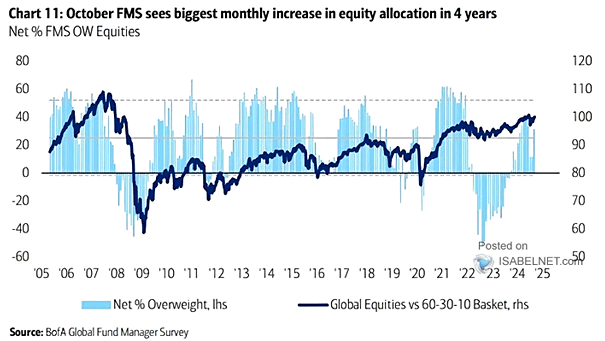
Equities – FMS Global Equity Allocation FMS investors significantly increased their equity allocation in October, the largest rise since June 2020. This shift is primarily due to a favorable economic climate resulting from the easing…
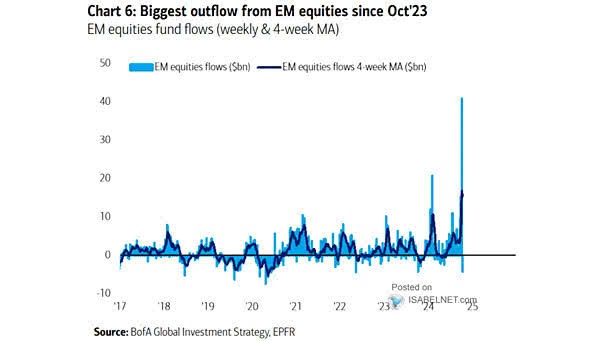
Emerging Market Equity Flows Emerging market equity funds have seen substantial outflows, highlighting the fragility of market sentiment amidst ongoing economic challenges. Image: BofA Global Investment Strategy
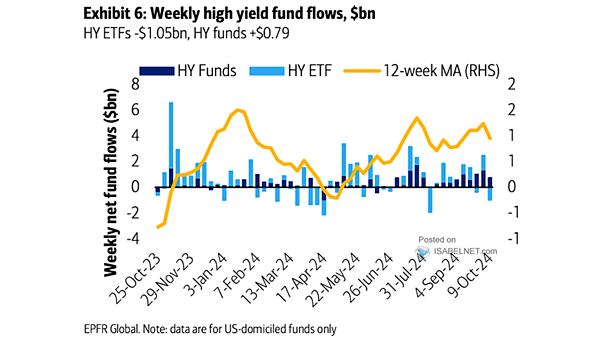
Weekly High Yield Fund Flows Over the past week, U.S. high-yield funds experienced their largest outflow in nine weeks, signaling a shift in investor sentiment towards lower-risk assets. Image: BofA Global Research
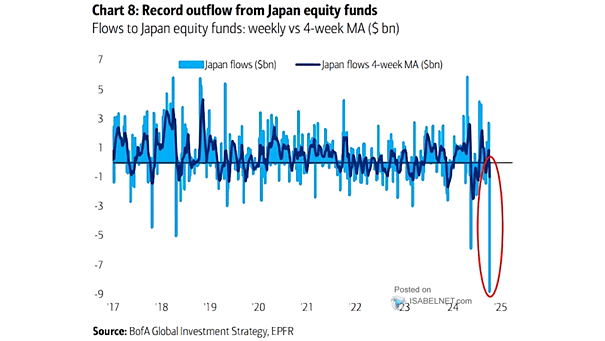
Flows to Japan Equities While Japanese equities have faced significant outflows recently due to shifting investor sentiment, underlying structural reforms and an evolving economic landscape may provide opportunities for recovery in the future. Image: BofA…