G10 FX Carry Trade Index

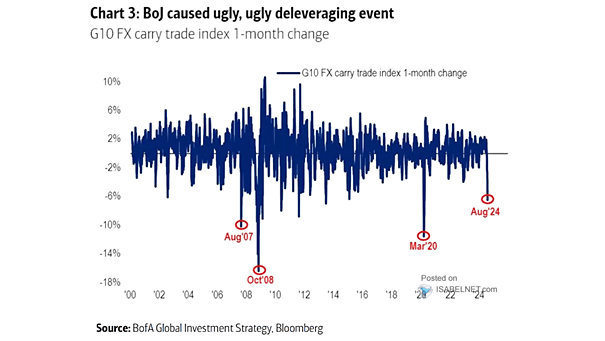
G10 FX Carry Trade Index The Bank of Japan’s recent actions caused market turmoil termed an “ugly deleveraging event,” reflecting ongoing economic challenges in Japan. Navigating a post-deflationary landscape adds complexity to the situation. Image:…
The Federal Reserve and Financial Crisis

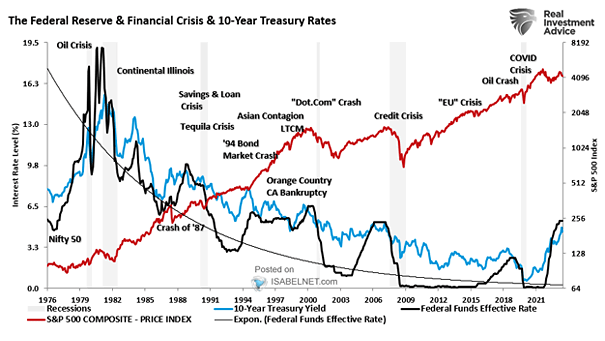
The Federal Reserve and Financial Crisis While the current rate hiking cycle hasn’t caused widespread financial crises yet, it’s premature to say it’s entirely different. The Fed must carefully balance controlling inflation, achieving maximum employment,…

High Yield Bond Flows

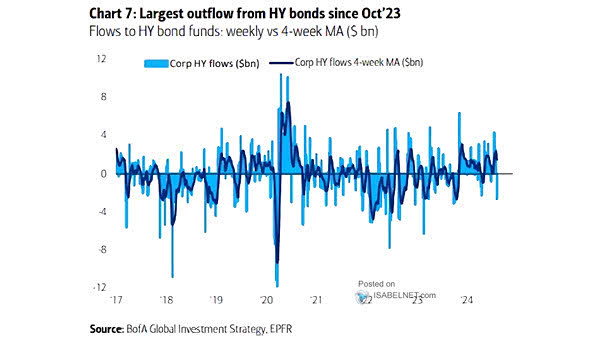
High Yield Bond Flows Persistence outflows from high yield bonds could signal a lack of confidence in the underlying companies and their capacity to fulfill debt obligations, making it a crucial indicator to monitor closely.…

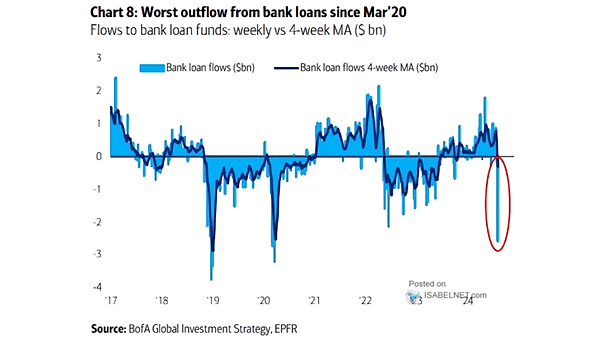
Bank Loan Flows

Bank Loan Flows The largest outflow from bank loan funds since March 2020 can be seen as a negative development and reflects negative investor sentiment. Image: BofA Global Investment Strategy

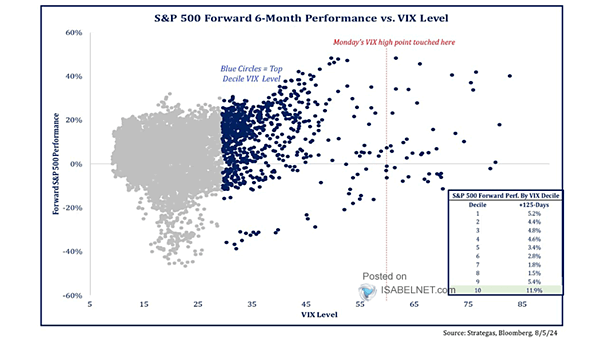
S&P 500 Forward 6-Month Performance vs. VIX Level

S&P 500 Forward 6-Month Performance vs. VIX Level Very high VIX readings may actually precede periods of strong market performance over the subsequent 6 months, as investor sentiment stabilizes and confidence returns. Image: Strategas Research…

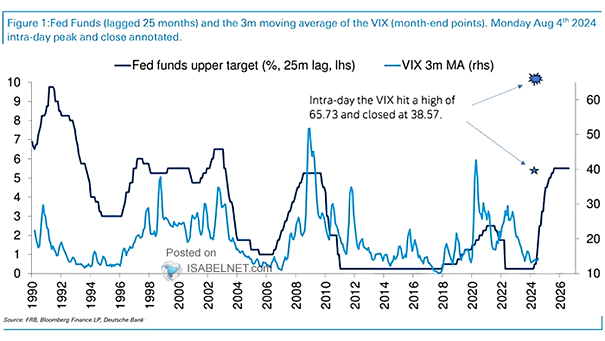
Fed Funds vs. VIX

Fed Funds vs. VIX Taking into account the lag effect of Fed rate hikes on the U.S. economy, should investors expect the VIX to continue being elevated? Image: Deutsche Bank

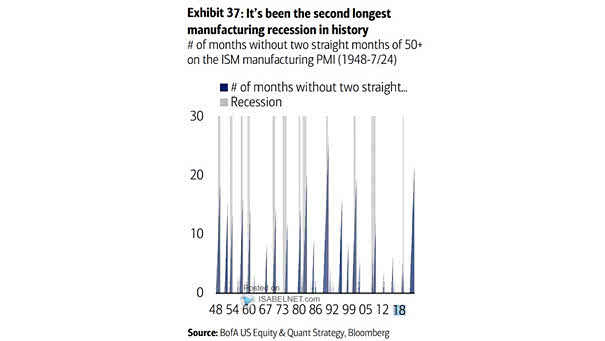
U.S. ISM Manufacturing Index and Recessions

U.S. ISM Manufacturing Index and Recessions The U.S. manufacturing sector is currently experiencing its second longest downturn in modern history, attributed to various factors, including elevated interest rates that have suppressed demand. Image: BofA US…

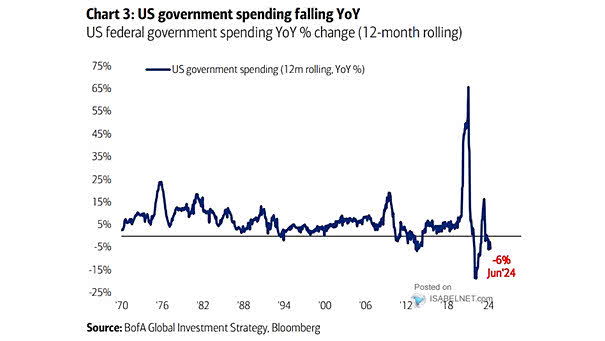
U.S. Government Spending

U.S. Government Spending U.S. government spending fell by 6% year-over-year, marking a notable shift. Image: BofA Global Investment Strategy

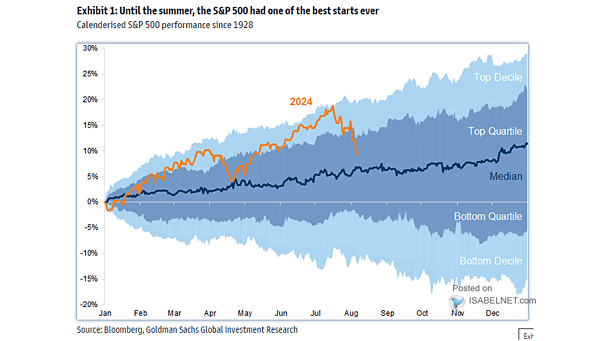
S&P 500 – Indexed Performance

S&P 500 – Indexed Performance Until the summer, the S&P 500 achieved one of its best starts in history, closely following the trajectory of 1995. During that year, the Fed cut interest rates, marking the…

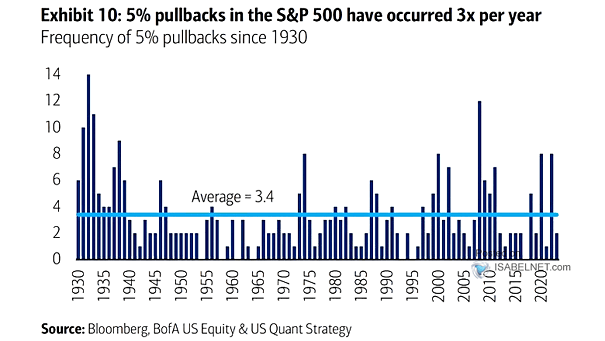
Pullbacks on the S&P 500

Pullbacks on the S&P 500 While 5% pullbacks can be unsettling, they are a normal part of the market cycle and often present good entry points for traders and investors to add exposure during a…

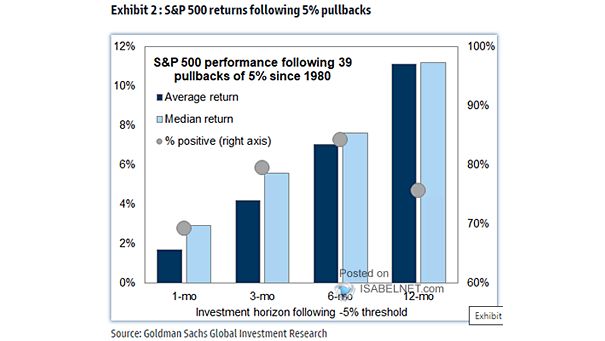
S&P 500 and Pullbacks

S&P 500 and Pullbacks While pullbacks can be challenging, historical data indicates that the S&P 500 tends to recover and move higher in the months following a 5% pullback. Image: Goldman Sachs Global Investment Research