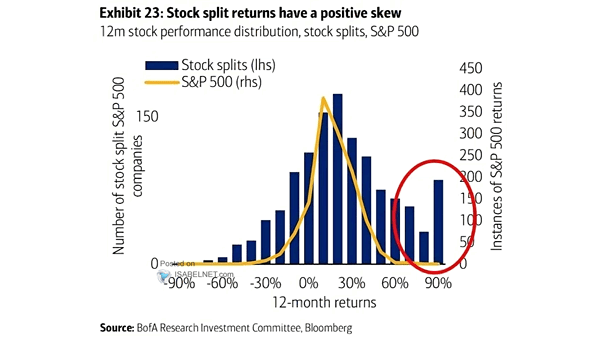
U.S. Initial Unemployment Claims After Yield Curve Inversion

U.S. Initial Unemployment Claims After Yield Curve Inversion Is there a difference this time in the association between an inverted yield curve, usually indicating economic decline, and the potential for job losses? Image: Morgan Stanley…

S&P 500 TTM EPS Before/After Earnings Troughs

S&P 500 TTM EPS Before/After Earnings Troughs After a period of decline, S&P 500 earnings tend to rebound and grow at a faster rate than the decline they experienced. This pattern may not apply to…

Valuation – Mega-Cap Tech vs. Rest of S&P 500 P/E

Valuation – Mega-Cap Tech vs. Rest of S&P 500 P/E Compared to the mega-cap tech stocks, the remaining stocks in the S&P 500 appear to be priced at a more reasonable level. Image: Goldman Sachs…

Conference Board Consumer Confidence and U.S. Treasury Yield Curve

Conference Board Consumer Confidence and U.S. Treasury Yield Curve Historically, the U.S. Treasury yield curve has tended to follow consumer confidence, underscoring the importance of monitoring consumer confidence as a potential indicator of future yield…

Gold-to-Copper Price Ratio

Gold-to-Copper Price Ratio The gold-to-copper price ratio is currently far from a level of complacency. Image: J.P. Morgan

Weighted Average Price Target for S&P 500 Companies

Weighted Average Price Target for S&P 500 Companies Goldman Sachs price targets imply a +19.3% return over the next 12 months, which suggests a bullish sentiment and very optimistic outlook. Image: Goldman Sachs Global Investment…

S&P 500 McClellan Oscillator

S&P 500 McClellan Oscillator The bullish divergence in the S&P 500 McClellan oscillator implies underlying buying pressure, signaling positivity for U.S. stocks and increasing the likelihood of a market reversal or bounce back. Image: BofA…

S&P 500 Index Valuation vs. Interest Rates

S&P 500 Index Valuation vs. Interest Rates The S&P 500 trading at relatively high valuations, should investors consider overweighting U.S. Treasury bonds while simultaneously underweighting U.S. equities in their investment portfolios? Image: Real Investment Advice

G10 Central Bank Balance Sheets

G10 Central Bank Balance Sheets The shrinking of G10 central bank balance sheets is a significant factor that can impact liquidity and potentially act as a headwind for equities. Image: Deutsche Bank

Returns – Value vs. Growth

Returns – Value vs. Growth Value stocks tend to outperform growth stocks when considering a longer time frame. Image: BofA Research Investment Committee