U.S. GDP Forecast
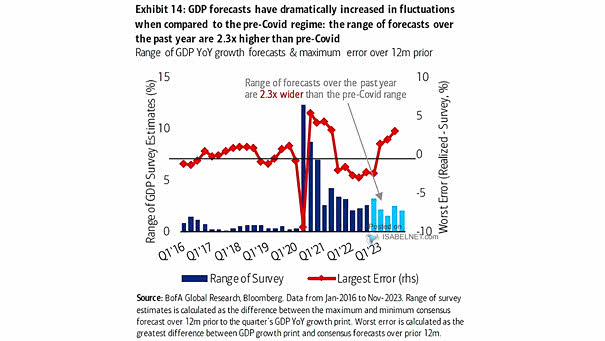
Range of U.S. GDP YoY Growth Forecasts and Maximum Error over 12-Month Prior While the U.S. economy may avoid a recession in 2024, U.S. GDP forecast dispersion remains at high levels, highlighting the inherent uncertainty…
Range of U.S. GDP YoY Growth Forecasts and Maximum Error over 12-Month Prior While the U.S. economy may avoid a recession in 2024, U.S. GDP forecast dispersion remains at high levels, highlighting the inherent uncertainty…
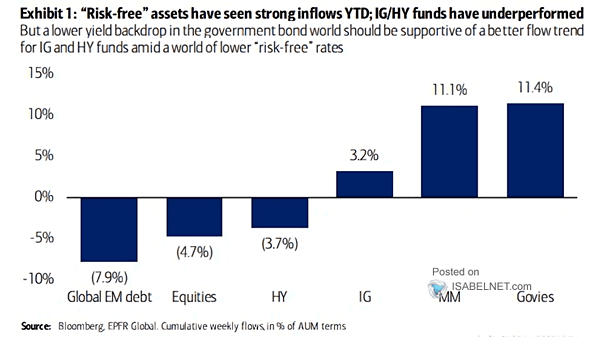
Cumulative Asset Flows in % of AUM Terms In 2023, there has been a notable trend of strong inflows into “risk-free” assets, indicating a growing preference for low-risk investment options in an environment of higher…
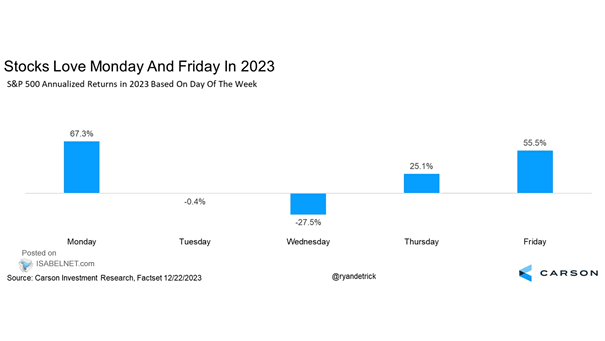
S&P 500 Average Return per Day In 2023, U.S. stocks have experienced high performance on Mondays and Fridays. The strong performance of the S&P 500 on Fridays reflects investor optimism and confidence in holding over…
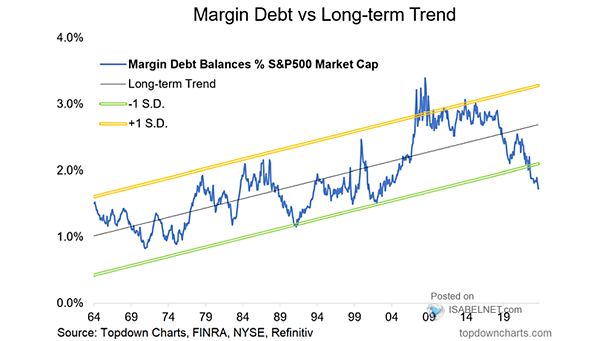
S&P 500 – Margin Debt vs. Long-Term Trend A rise in the ratio of margin debt to the S&P 500 market cap could indicate a bullish outlook for the U.S. stock market, potentially signaling confidence…
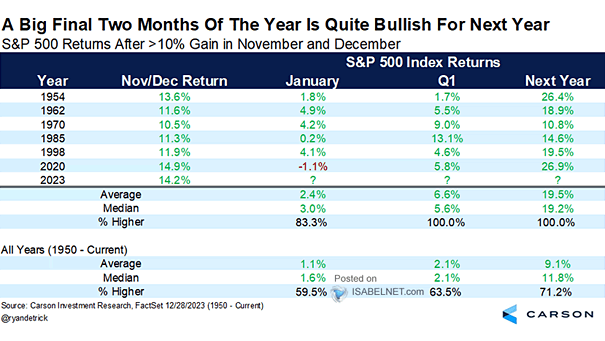
S&P 500 Returns After >10% Gain in November and December When the S&P 500 posts a gain of more than 10% in November and December, it tends to perform strongly in Q1 and the following…
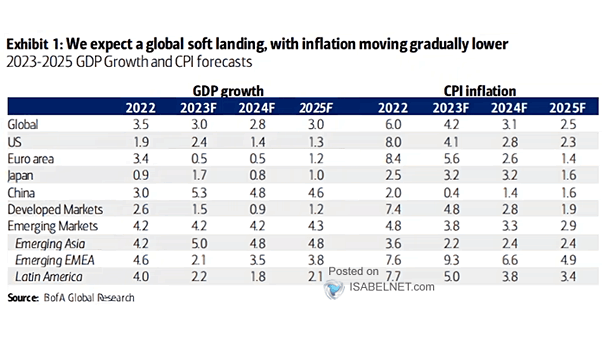
GDP Growth and CPI Forecasts In 2024, global growth is expected to mildly decelerate, followed by a gradual recovery in 2025. Additionally, inflation is projected to gradually decrease across most countries. Image: BofA Global Research
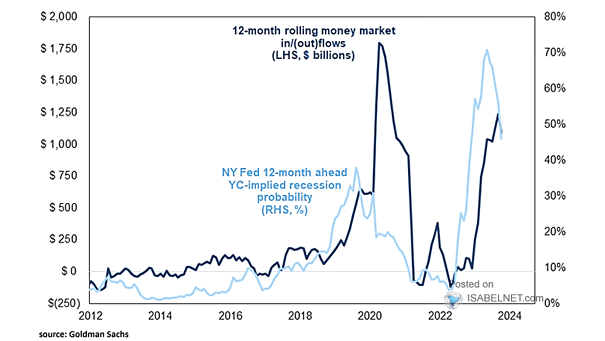
12-Month Rolling Money Market In/(Out)Flows vs. NY Fed 12-Month Ahead Yield Curve Implied Recession Probability The probability of a U.S. recession can significantly influence investor behavior, potentially leading to a rotation out of money markets…
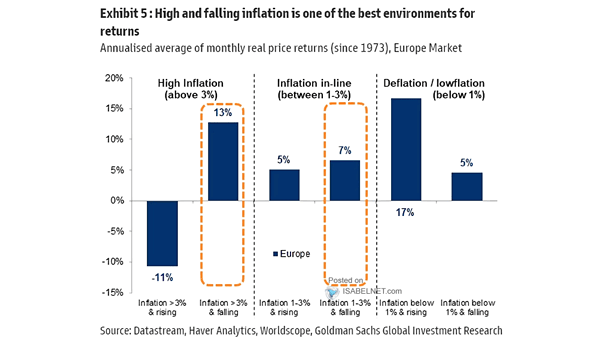
Europe Market – Annualized Average of Monthly Real Price Returns High and falling inflation is generally a favorable environment for returns. Image: Goldman Sachs Global Investment Research
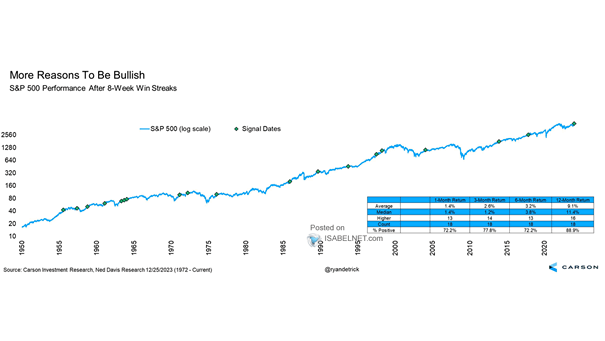
S&P 500 Performance After 8-Week Win Streaks Historically, 8-week win streaks tend to be bullish for U.S. stocks over the next 12 months, giving investors a potential reason to expect a positive year in 2024.…
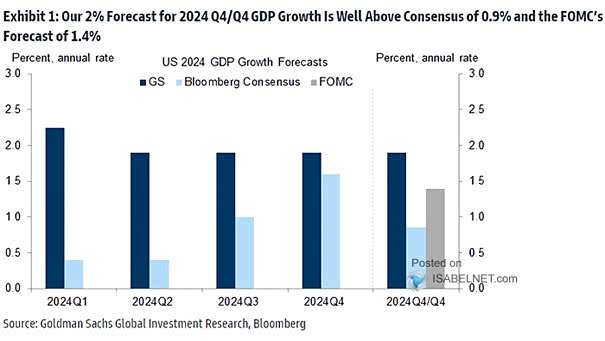
U.S. GDP Growth Forecasts Goldman Sachs is more bullish on U.S. GDP growth than the consensus and the FOMC’s forecast, reflecting their confidence in a stronger performance for the U.S. economy. Image: Goldman Sachs Global…
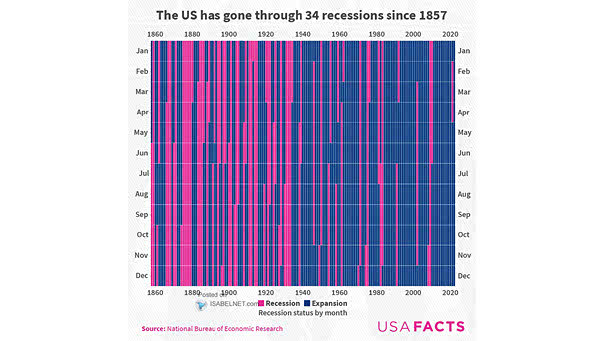
U.S. Economic Expansions and Recessions There has been a general trend towards less frequent recessions in the United States over recent decades, which reflects the evolving nature of the U.S. economy and its resilience in…