Valuation – S&P 500 Forward P/E Multiple
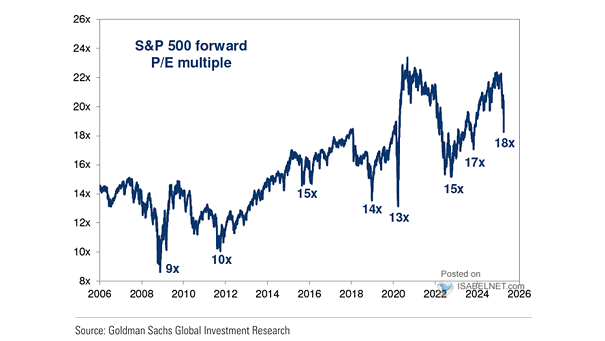
Valuation – S&P 500 Forward P/E Multiple Since October, the S&P 500’s P/E has slipped from 23 to 19, showing investors have turned more cautious even as earnings hold steady. The mood has cooled, and…
Valuation – S&P 500 Forward P/E Multiple Since October, the S&P 500’s P/E has slipped from 23 to 19, showing investors have turned more cautious even as earnings hold steady. The mood has cooled, and…
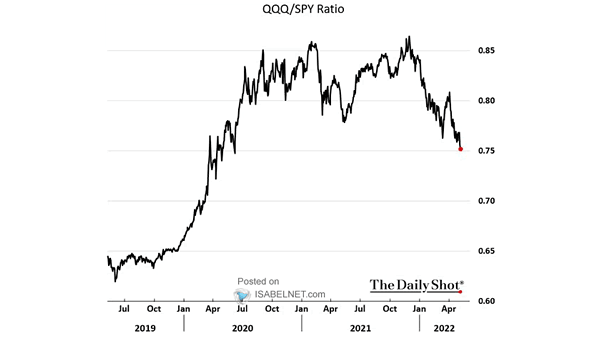
Nasdaq 100 to S&P 500 Valuation Spread The last time the Nasdaq 100 traded this cheap versus the S&P 500, it staged its biggest outperformance in a year. Honestly, that’s tough to ignore. Image: Bloomberg
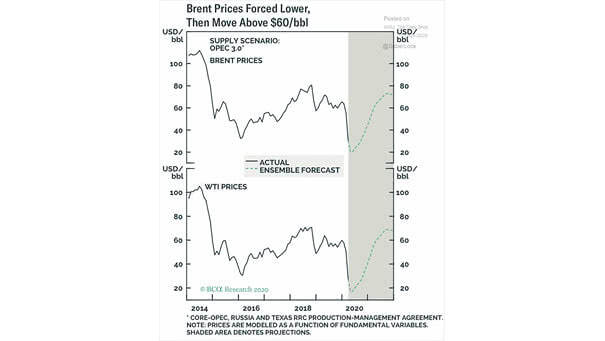
Brent Crude Oil Futures Markets are betting the Middle East conflict won’t drag on, a view reflected in oil futures prices. The curve remains in backwardation, indicating tight near‑term supply but confidence that any disruption…
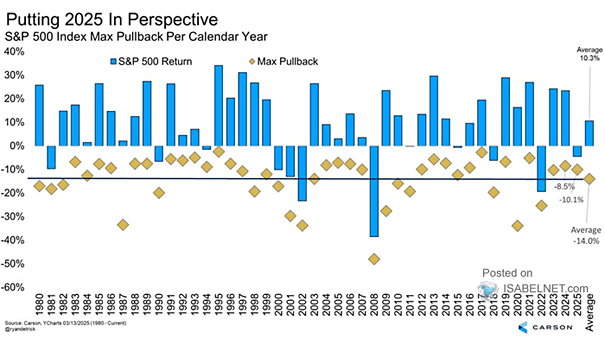
S&P 500 Index Max Pullback per Calendar Year Markets are never a straight ride up. Since 1980, the S&P 500 has averaged double‑digit gains while dropping roughly 14% each year. Volatility is simply the cost…
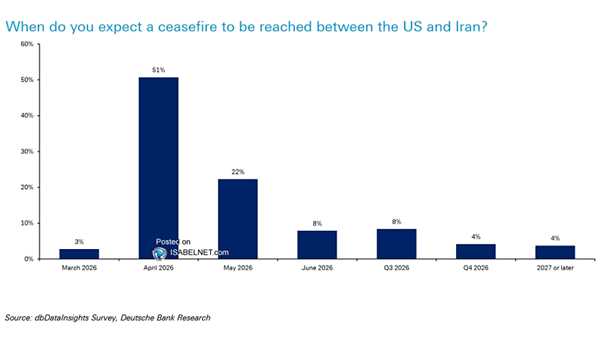
When Do You Expect a Ceasefire to Be Reached Between the U.S. and Iran? Investors are largely treating the Middle East conflict as a temporary shock, with most expecting a U.S.-Iran ceasefire before the end…
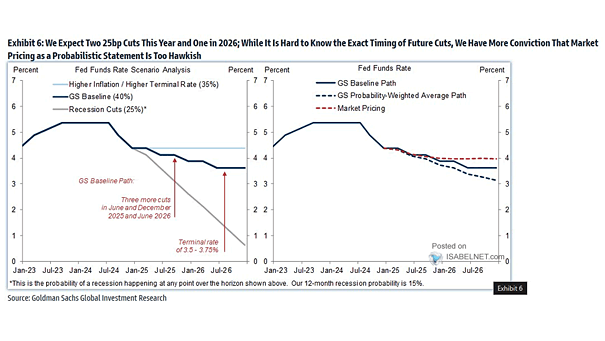
Fed Funds Rate Markets are now pricing in a meaningful chance of a Fed rate hike in 2026, something that looked very unlikely at the start of the year. Image: MarketDesk Research
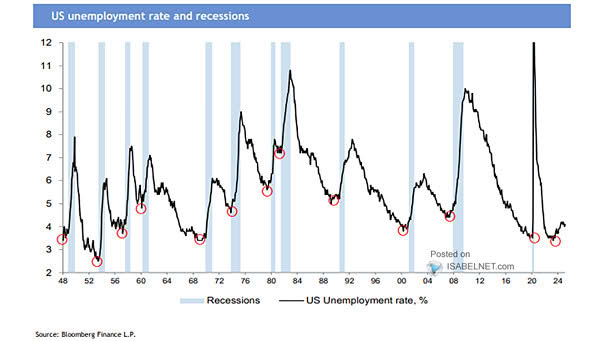
U.S. Unemployment Rate and Recessions The unemployment rate moving above its three-year average has preceded every U.S. recession since 1950. The latest crossover came in June 2024. Since then, no recession has followed, raising questions…
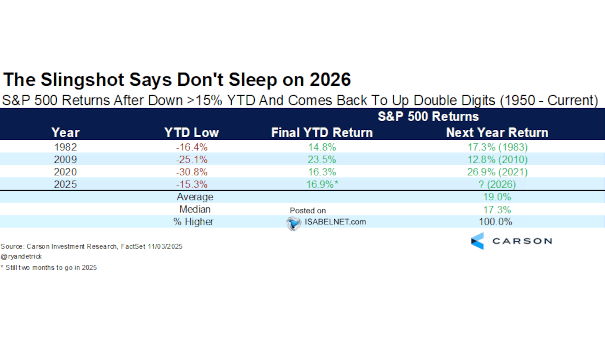
S&P 500 Returns After Down >15% YTD and Comes Back to Up Double Digits History favors the bulls. Every time the S&P 500 has dropped more than 15% in a year and then roared back…
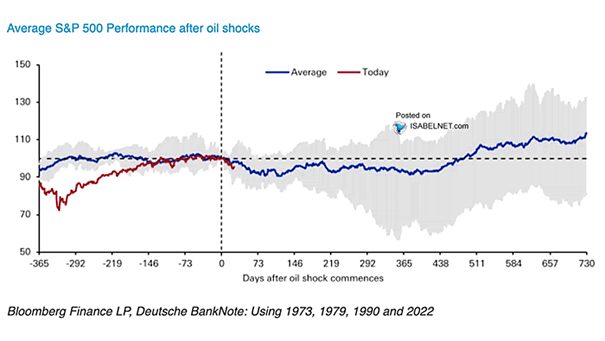
Average S&P 500 Performance After Oil Shocks On average, U.S. equities have tended to be under pressure in the months following major oil shocks, though the pattern is not uniform and depends heavily on whether…
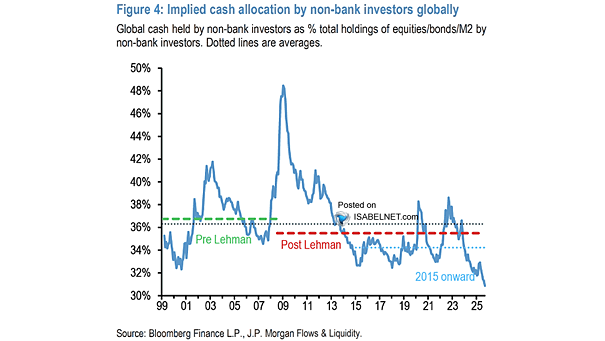
Cash Allocation by Non-Bank Investors Globally Non‑bank global investors are rotating out of stocks and bonds and into cash as the Middle East conflict‑related energy shock raises inflation fears and the risk of higher interest…
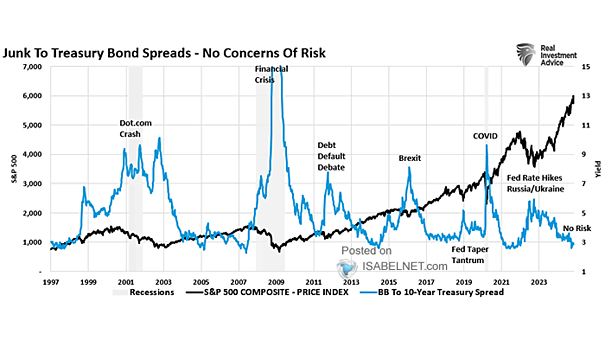
S&P 500 Index and BB to 10-Year Treasury Spread Keeping an eye on the junk to Treasury bond spread can reveal how healthy the U.S. market really is, and where it might be going next.…