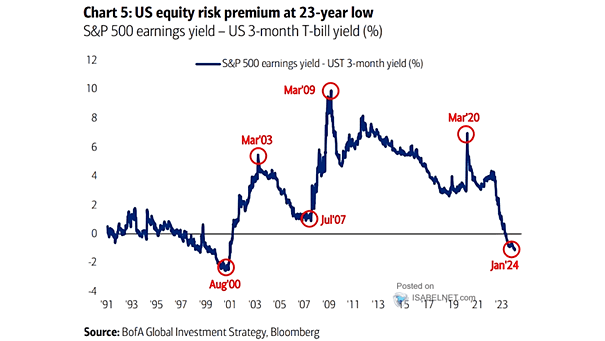
S&P 500 Earnings Yield – UST 3-Month Yield
S&P 500 Earnings Yield – UST 3-Month Yield Historically, when the cash yield exceeds the earnings yield, this is often seen as a headwind for equities, as investors tend to prefer allocating their funds to…
S&P 500 Earnings Yield – UST 3-Month Yield Historically, when the cash yield exceeds the earnings yield, this is often seen as a headwind for equities, as investors tend to prefer allocating their funds to…
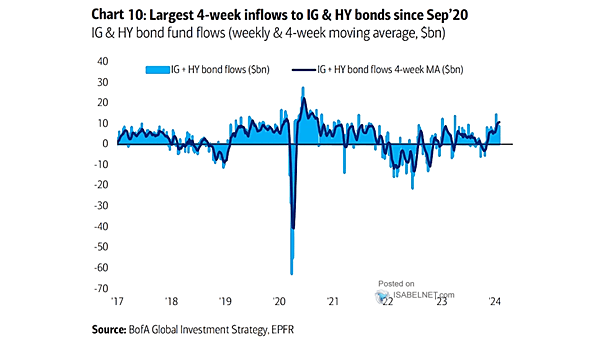
IG + HY Bond Fund Flows Despite the potential risks associated with investing in IG and HY bond funds, continued strong inflows to these funds indicate a positive sentiment among investors. Image: BofA Global Investment…
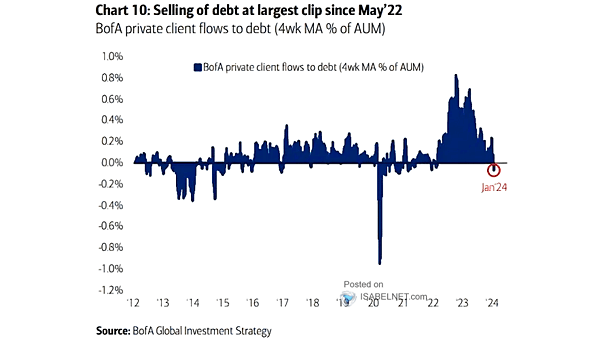
GWIM Flows to Debt The significant rate at which BofA’s private clients are selling debt may reflect a change in investment strategy. Image: BofA Global Investment Strategy
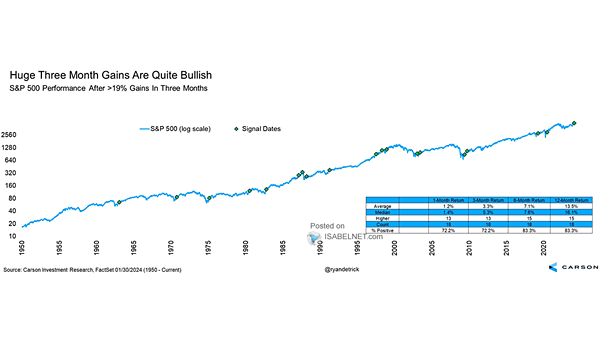
S&P 500 Performance After >19% Gains in Three Months According to historical data, when the S&P 500 posts a gain of more than 19% in three months, it suggests a bullish outlook over the next…
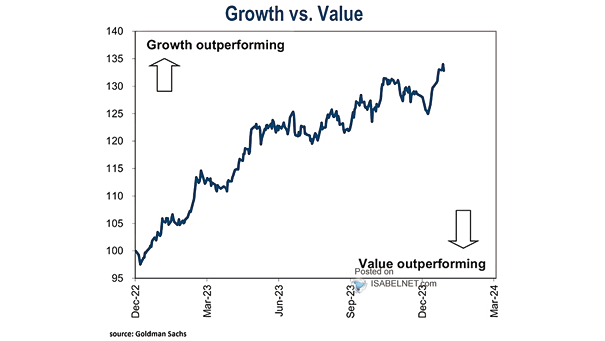
Performance – Growth vs. Value During times of scarce growth, growth stocks tend to outperform value stocks, while during periods of plentiful growth, value stocks tend to outperform growth stocks. Image: Goldman Sachs Global Investment…
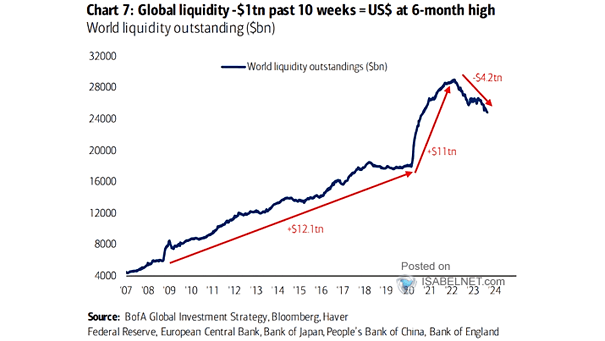
Liquidity Policies and Central Bank Balance Sheets Central banks have barely decreased the amount of QE stock, suggesting a deliberate and measured strategy in scaling back economic support. Image: BofA Global Investment Strategy
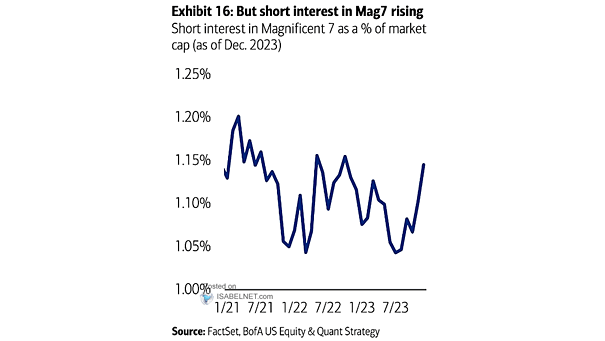
Stocks – Short Interest in Magnificent 7 as a % of Market Capitalization Short interest in the Magnificent 7 stocks is rising, as their high valuations have raised concerns among investors. Image: BofA US Equity…
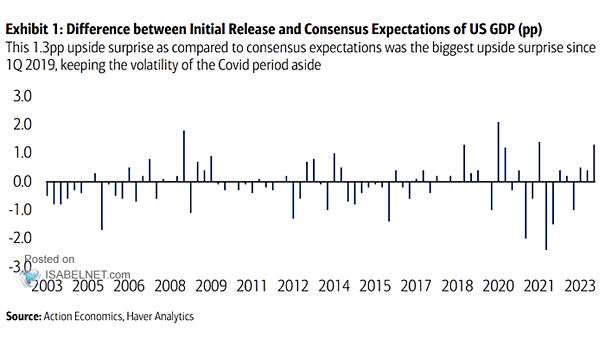
Difference Between Initial Release and Consensus Expectations of U.S. GDP U.S. GDP was one of the biggest upside surprise compared to consensus expectations, highlighting the challenges of accurately forecasting economic trends and outcomes. Image: BofA…
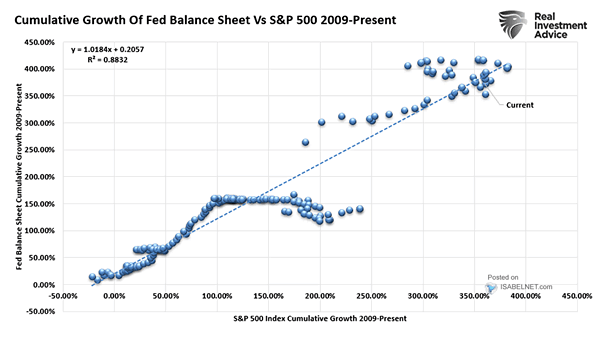
Cumulative Growth of Fed Balance Sheet and S&P 500 Index Cumulative Growth The expansion of the Fed’s balance sheet tends to have a positive impact on the S&P 500 Index, suggesting a correlation between the…
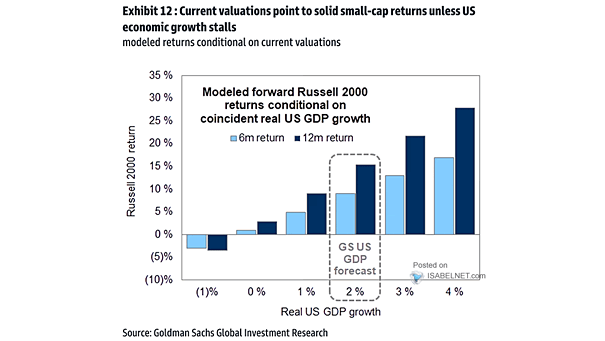
Modeled Forward Russell 2000 Returns Conditional on Coincident Real U.S. GDP Growth The performance of small-cap stocks is linked to economic conditions. Weak U.S. economic growth may affect their returns, while strong growth offers potential…