Energy vs. S&P 500, Relative Price Performance
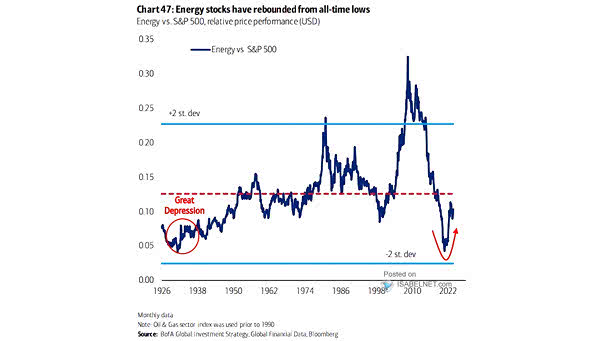
Energy vs. S&P 500, Relative Price Performance Should investors consider overweighting their exposure to energy stocks in their portfolios? Image: BofA Global Investment Strategy
Energy vs. S&P 500, Relative Price Performance Should investors consider overweighting their exposure to energy stocks in their portfolios? Image: BofA Global Investment Strategy
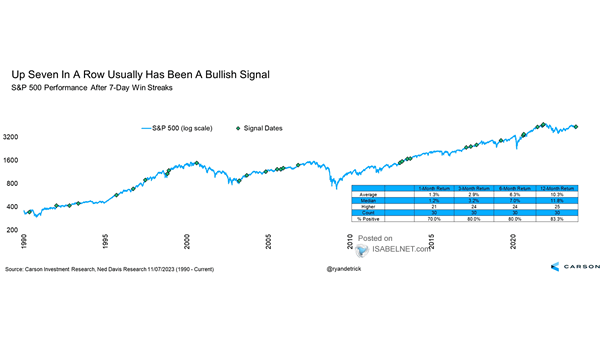
S&P 500 Performance After 7-Day Win Streaks Historically, 7-day win streaks tend to be bullish for U.S. stocks over the next 12 months. Image: Carson Investment Research
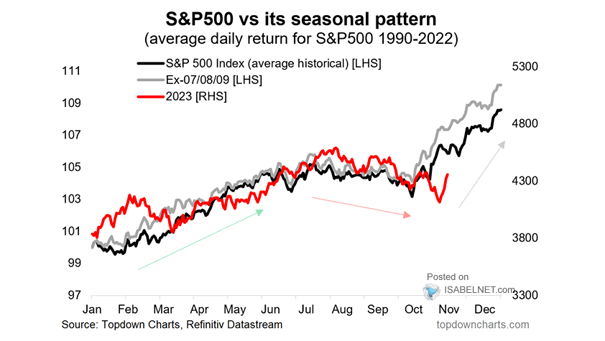
S&P 500 vs. Its Seasonal Pattern While past performance does not guarantee future results, can the U.S. stock market continue to follow its seasonal pattern? Image: Topdown Charts
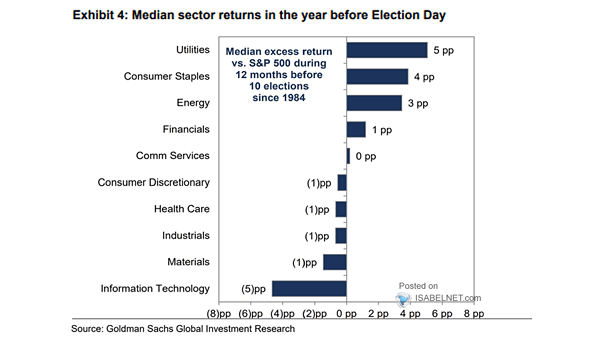
Median Sector Returns in the Year Before U.S. Election Day Given the historical trend of the tech sector underperforming the S&P 500 in the year preceding the U.S. election day, should investors consider underweighting their…
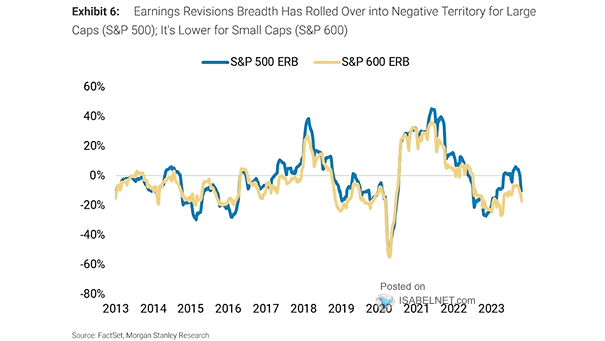
S&P 500 Earnings Revisions Breadth Earnings revisions breadth for both large and small caps has returned to negative territory, which means that the overall sentiment and expectations for future earnings have worsened. Image: Morgan Stanley…
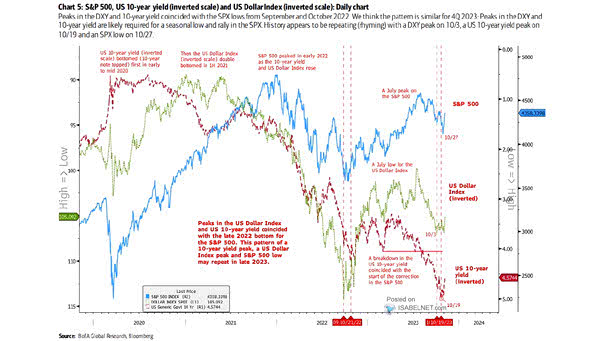
S&P 500, U.S. 10-Year Yield and U.S. Dollar Index Peaks in the U.S. dollar and U.S. 10-year Treasury yields are seen as essential to catalyze a year-end rally in the S&P 500. Image: BofA Global…
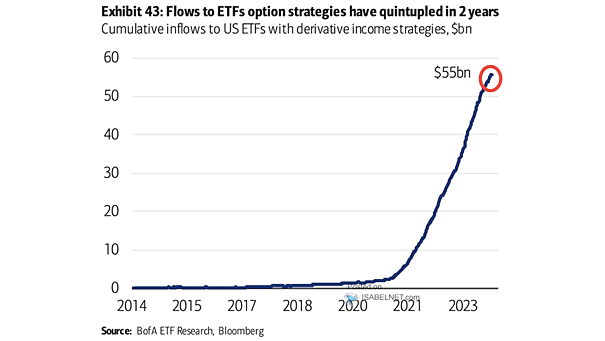
Cumulative Inflows to U.S. ETFs with Derivative Income Strategies Over the course of the past two years, the scale of capital flows into U.S. ETFs via options strategies has increased dramatically, reflecting a shift in…
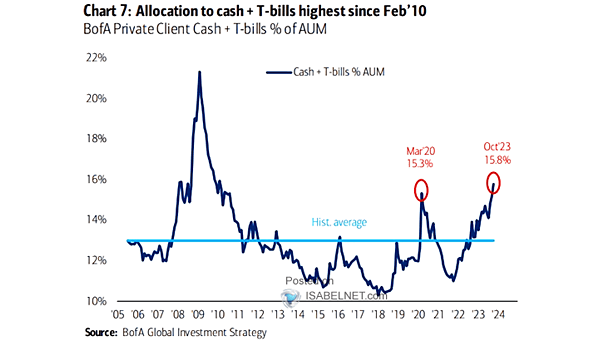
Cash + T-bills % of AUM Will cash and T-bills serve as the driving force behind the bull markets of 2024? Image: BofA Global Investment Strategy
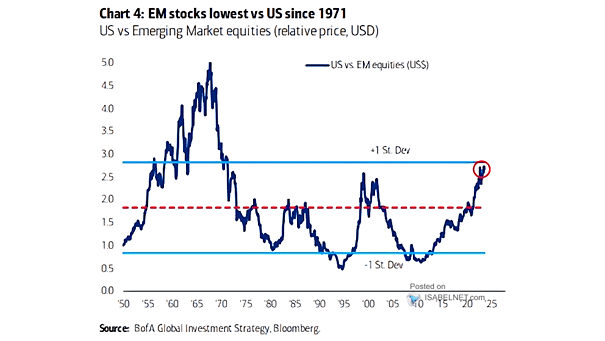
U.S. vs Emerging Market Equities Relative Price Performance Will the secular outperformance of U.S. equities vs. emerging market equities come to an end in 2024? Image: BofA Global Investment Strategy
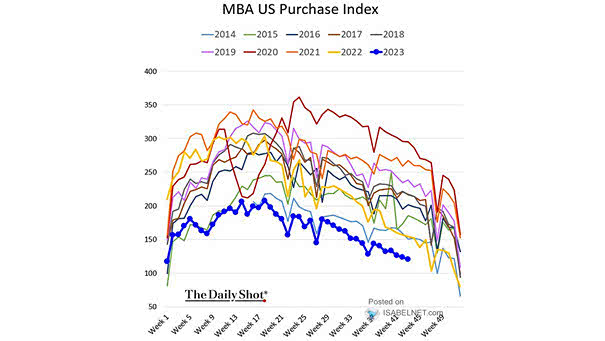
U.S. Housing Market – MBA Purchase Index Mortgage applications in the U.S. continue to decline due to a combination of high interest rates and elevated home prices, resulting in a 28-year low. Image: The Daily…
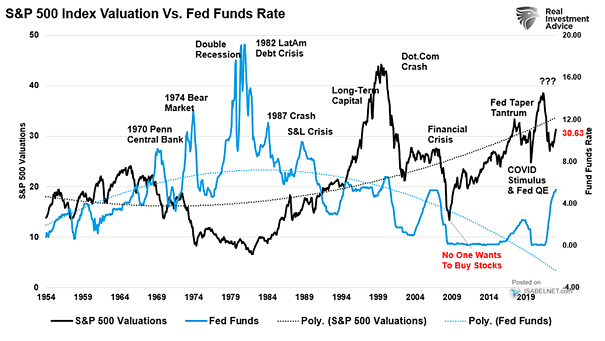
S&P 500 Index Valuation vs. Fed Funds Rate Given that much of the stock market’s progress this year can be attributed to valuation expansion, it is likely that U.S. stocks will eventually experience a correction…