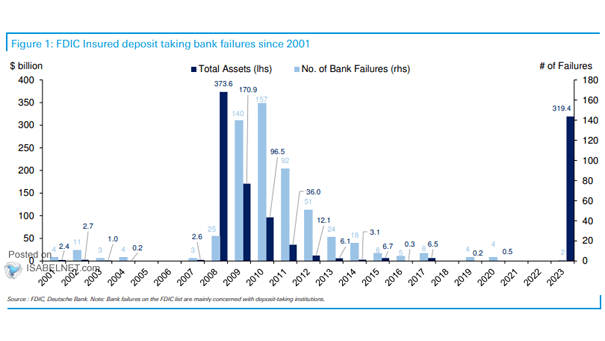
Historical U.S. Inflation Episodes
Historical U.S. Inflation Episodes Is it the last U.S. inflation peak of this cycle? Image: BofA Research Investment Committee
U.S. ISM Manufacturing PMI vs. Philly Fed Futures Orders (Leading Indicator) Will the ISM Manufacturing PMI fall further, as a recession is looming in the United States? Image: Topdown Charts
Valuation – MSCI AC World 12-Month Forward P/E and 10-Year Real U.S. Treasury Yield 10-year U.S. real yields help explain the valuation of global equities. Image: Goldman Sachs Global Investment Research
U.S. Small Cap Stocks – S&P 600 / S&P 500 U.S. small business confidence is deteriorating, which does not bode well for U.S. small-caps, but relative valuations remain attractive. Image: BCA Research
S&P 500 – Trifecta of the Santa Claus Rally, First 5 Days of the Year, and January All Green Could the S&P 500 end the year higher with a double-digit gain? Image: Carson Investment Research
U.S. Equity Risk Premium vs. ISM Manufacturing and ISM Services The equity risk premium is likely to rise if a U.S. recession occurs this year. Image: Goldman Sachs Global Investment Research
Inflation – U.S. ISM Services PMI vs. U.S. CPI The ISM Services PMI tends to lead U.S. CPI by three months. Image: Morgan Stanley Research
Valuation – U.S. Median 12-Month Trailing P/E and YoY CPI Inflation Historically, the sweet spot for valuations is generally a low inflation environment, between 1% and 3%. Image: Goldman Sachs Global Investment Research
S&P 500 Earnings Surprise % Recent earnings surprises are slightly positive. Image: Morgan Stanley Research
U.S. Recessions and ISM Services PMI The ISM Services PMI below 50 is a warning signal of a coming recession in the United States. Image: Morgan Stanley Research