S&P 500 and Liquidity
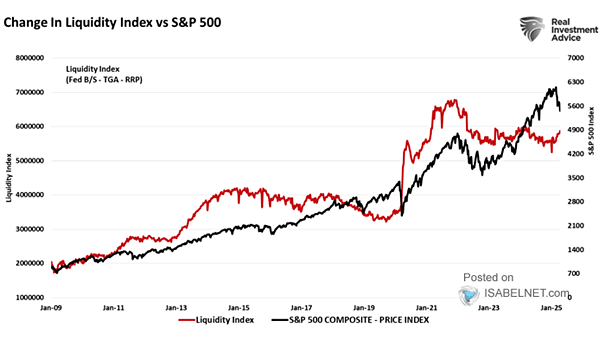
S&P 500 and Liquidity Liquidity stays abundant. But since 2022, dip-buyers have stopped tracking liquidity and started trading on Fed whispers, reading signals more than balance sheets. Image: Real Investment Advice
S&P 500 and Liquidity Liquidity stays abundant. But since 2022, dip-buyers have stopped tracking liquidity and started trading on Fed whispers, reading signals more than balance sheets. Image: Real Investment Advice
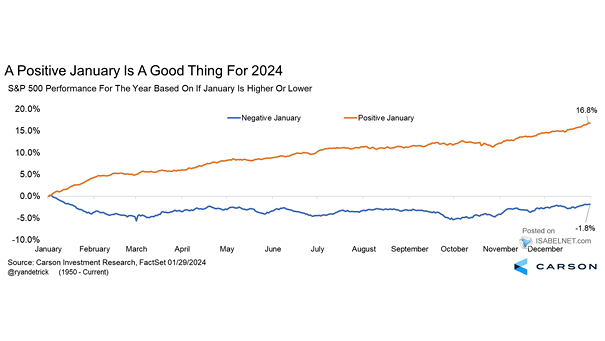
S&P 500 Index Returns Based on If January Is Higher or Lower Bulls have reason to smile: a positive January often sets the tone for a bullish year. When the S&P 500 finishes the month…
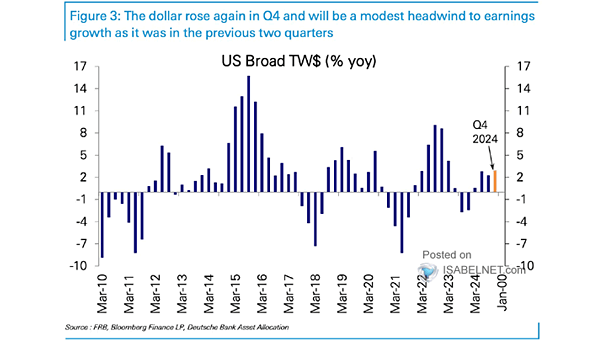
U.S. Dollar Index (DXY) A steady U.S. dollar holding its range might be just what traders and markets need. But let it slip below 90 with conviction, and sentiment can turn quickly: what once looked…
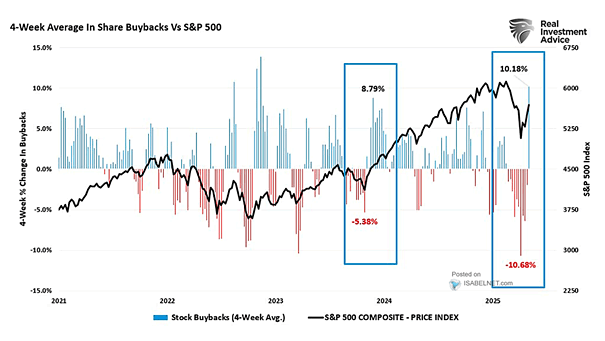
S&P 500 Buybacks vs. S&P 500 Composite 12-Month Trailing EPS Corporate buybacks and earnings growth have risen hand in hand. Much of that growth, though, reflects companies lifting their own share prices. With valuations stretched,…
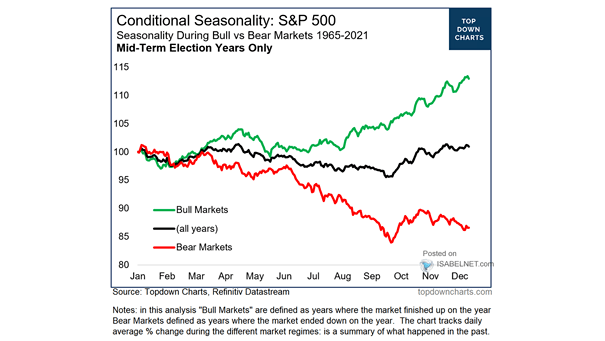
S&P 500 – Seasonality During Bull vs. Bear Markets (Midterm Election Years Only) Bull markets don’t offer immunity. U.S. midterm election years tend to bring choppier trading and elevated volatility for the S&P 500 until…
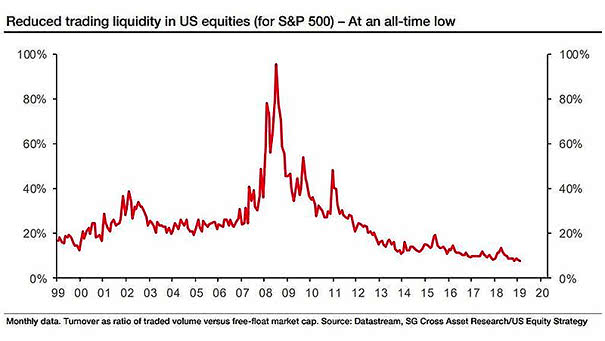
S&P 500 and Liquidity Index Improving liquidity is setting a friendlier tone for U.S. equities, helped by the Fed’s shift in balance sheet policy. The biggest shake-up could come once Trump’s new Fed chief runs…
U.S. Equity Valuation Metrics (Z-Score Since 1900) U.S. equity valuations are still lofty, with major gauges more than two standard deviations above century-long norms. Cheap is not the word that comes to mind. Image: The…
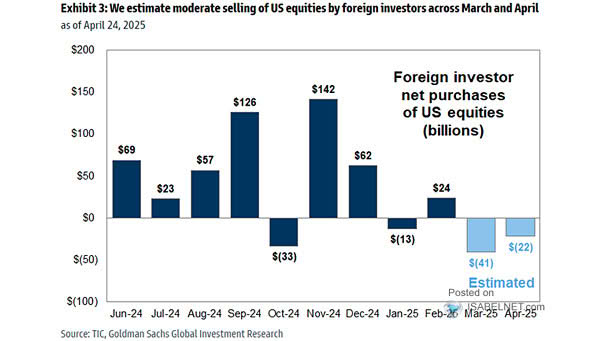
Foreign Investors Equity Allocation Percentile vs. History In 2025, foreign investors substantially increased their holdings of U.S. equities, reaching record levels despite stretched valuations, a weakening dollar and better returns abroad. Image: Goldman Sachs Global…
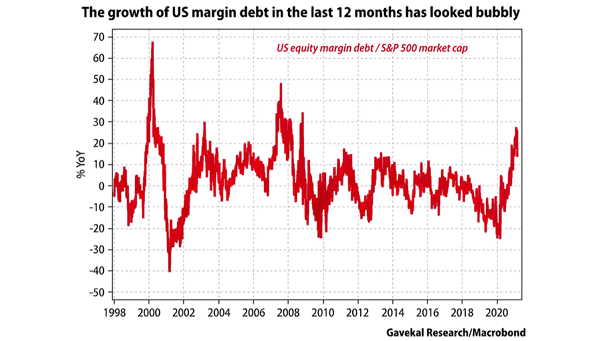
FINRA Debit Balance in Securities Margin Accounts Leverage in margin accounts has surged since April 2025, reflecting strong market optimism. The catch is that higher leverage can turn painful fast when volatility spikes, triggering forced…
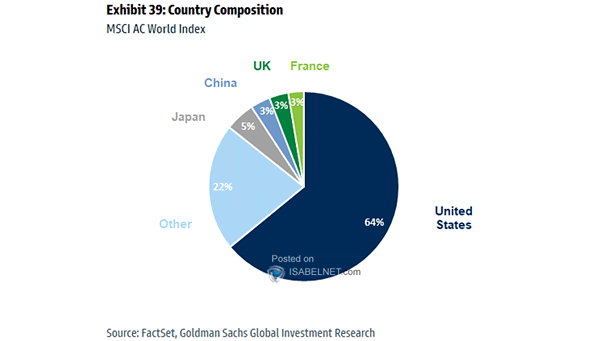
Share of Global Market Capitalization The U.S., with barely 4% of the world’s people, dominates 63% of global equity value. Its innovation engines continue to magnetize foreign money. Like it or not, global markets still…
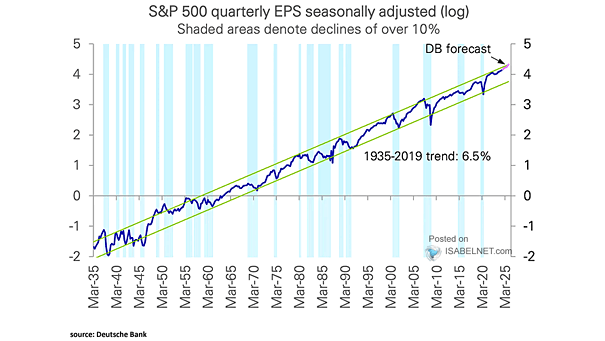
S&P 500 Earnings & Estimates and Earnings Growth Trend Line S&P 500 earnings have significantly outpaced historical growth trends. If profits start to slip in the coming quarters, richly valued stocks could face a sharp…