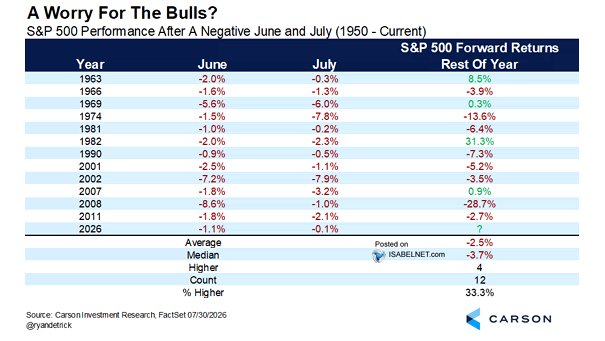
S&P 500 Performance After a Negative June and July
S&P 500 Performance After a Negative June and July The S&P 500 fell 0.1% in July. Bulls can call it noise, but bears will see a familiar pattern. Since 1950, when both June and July…
S&P 500 Performance After a Negative June and July The S&P 500 fell 0.1% in July. Bulls can call it noise, but bears will see a familiar pattern. Since 1950, when both June and July…
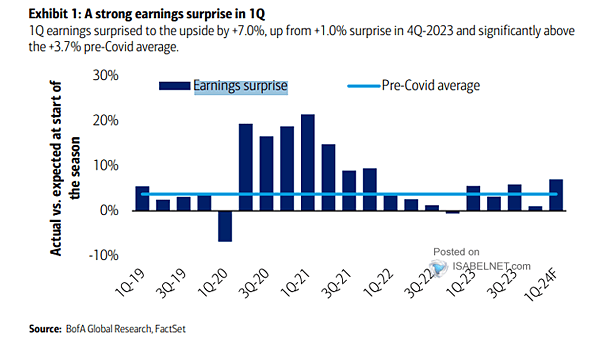
Aggregate Earnings Surprise – S&P 500, Nasdaq 100, Philly Semiconductors, Bloomberg AI Value Chain The S&P 500 just posted its strongest earnings season in years, powered by AI-driven profits. When the index beats estimates by…
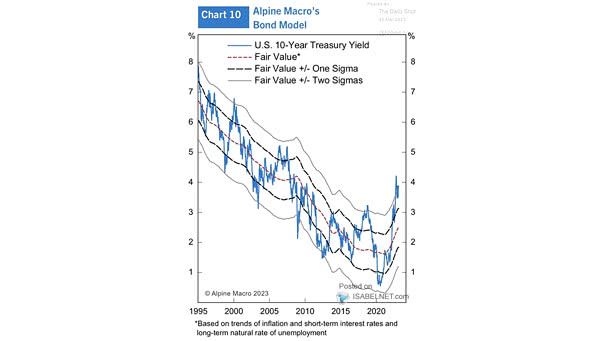
U.S. 10-Year Treasury Yield and Fair Value Model The 10-year U.S. Treasury is yielding about 4.7%, roughly 40 basis points above its fair-value estimate of 4.3%. That spread favors mean-reversion trades over outright directional bets.…
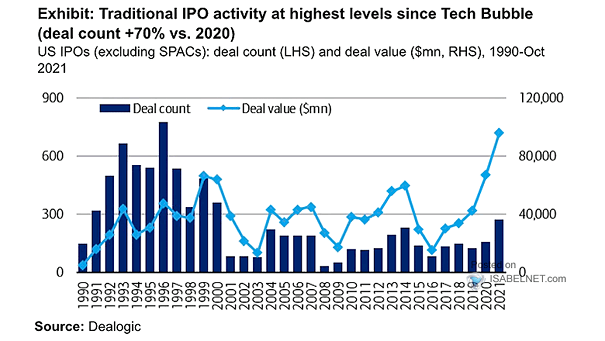
SpaceX and Median of 20 Largest IPOs on Nasdaq Wall Street’s old joke that IPO stands for “It’s Probably Overpriced” feels a little less funny now, but not entirely wrong. SpaceX is lagging most other…
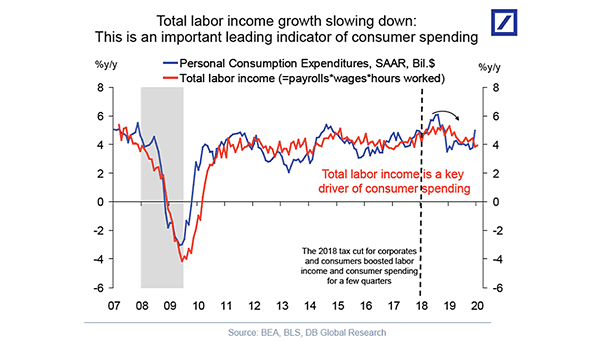
Real U.S. Personal Consumption Expenditures Y/Y Growth In recent quarters, U.S. consumers have continued to reallocate spending toward experience‑driven categories like travel, dining and recreation, even as overall services spending growth has cooled. Image: Goldman…
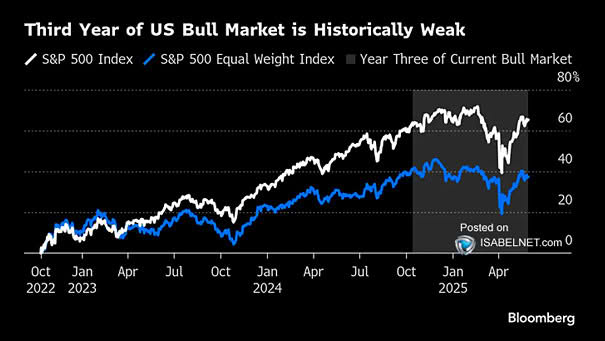
Equal-Weight S&P 500 (RSP) Relative to Cap-Weight S&P 500 (SPY) As megacap leadership fades, market breadth is improving. This isn’t an outflow from equities. It’s just a rotation out of concentration. Image: Real Investment Advice
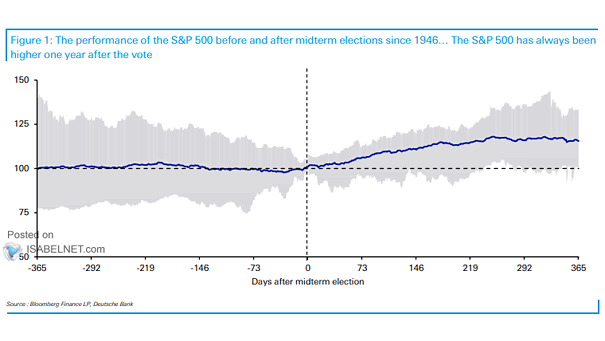
The Performance of the S&P 500 Before and After Midterm Elections History has been kind to investors after midterms. In all 20 midterm elections since World War II, the S&P 500 has been higher nine…
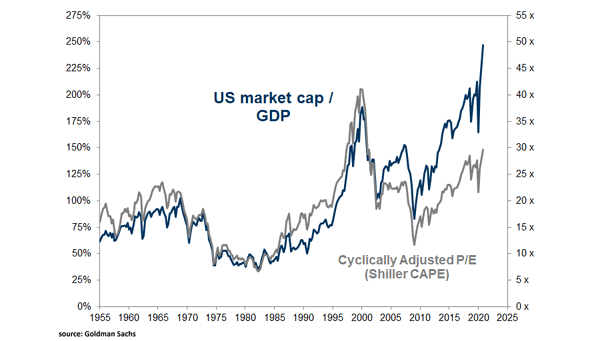
Valuation – Shiller Cyclically-Adjusted S&P 500 Price-to-Earnings Ratio On the Shiller CAPE, U.S. stocks are back in the stratosphere, the kind that thrills investors on the way up and has a habit of burning them…
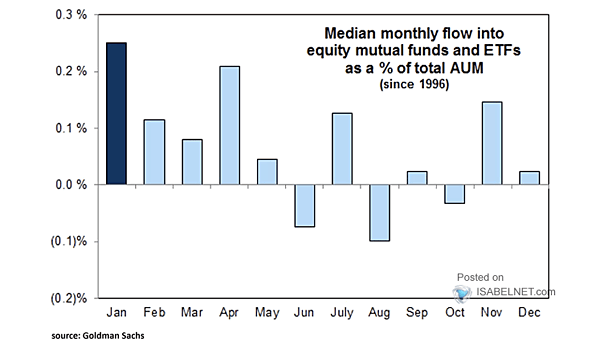
Median Monthly Flow into Equity Mutual Funds and ETFs as a % of Total AUM August rivals May as the worst month for equity outflows from mutual funds and ETFs. As geopolitical risk builds, should…
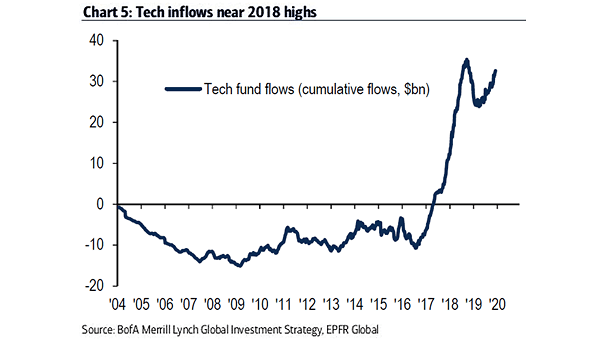
U.S. Tech Sector Flows Despite the pullback in tech names, the money isn’t leaving: Tech inflows persist and semi ETFs are still seeing heavy volume. This looks like a consolidation, not the end of the…
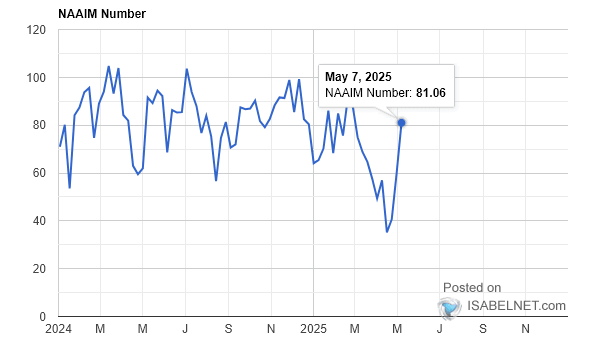
NAAIM Exposure Index – Investor Sentiment The NAAIM Exposure Index at 79.70 shows that active managers are still risk-on, with robust U.S. equity exposure and a bullish outlook. The National Association of Active Investment Managers Exposure Index…