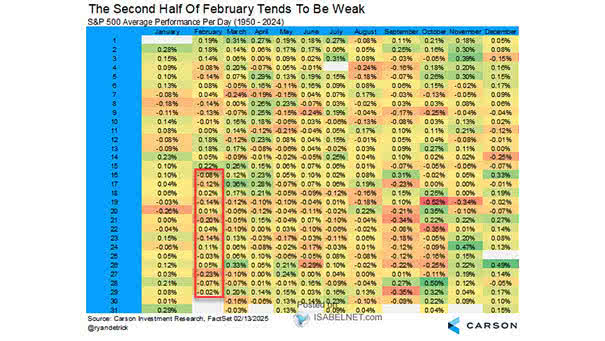
S&P 500 Index Single Day Average Returns
S&P 500 Index Single Day Average Returns Saint Patrick’s Day is putting a smile on the bulls, as it’s not just one of the greenest days of the year but also historically the strongest for…
S&P 500 Index Single Day Average Returns Saint Patrick’s Day is putting a smile on the bulls, as it’s not just one of the greenest days of the year but also historically the strongest for…
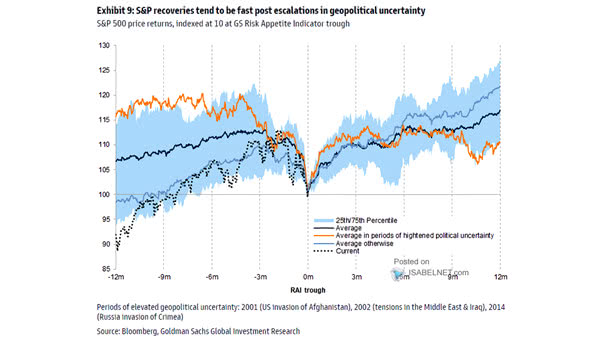
S&P 500 Return Around 7 Major Geopolitical Risk Events The S&P 500’s 5% slide from its January peak mirrors the market’s typical pullback after major geopolitical shocks. Many investors see the turbulence as temporary, betting…
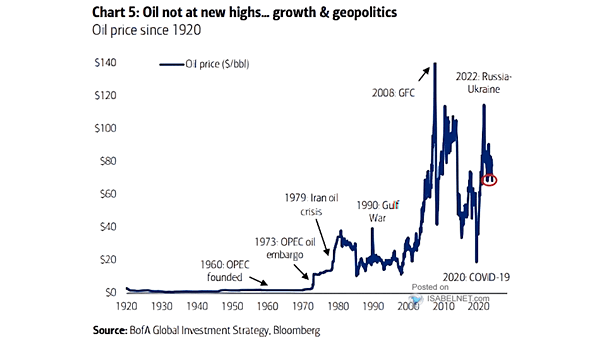
S&P 500 and Crude Oil Since the conflict erupted in the Middle East, the S&P 500 has been moving almost opposite to oil, showing a striking 91% inverse correlation. When crude rises, investors often worry…

S&P 500 Performance When Q1 Low Breaks the December Low Close When the S&P 500 sinks below its December low in the first quarter, history tends to flash a warning light. On average, U.S. stocks…
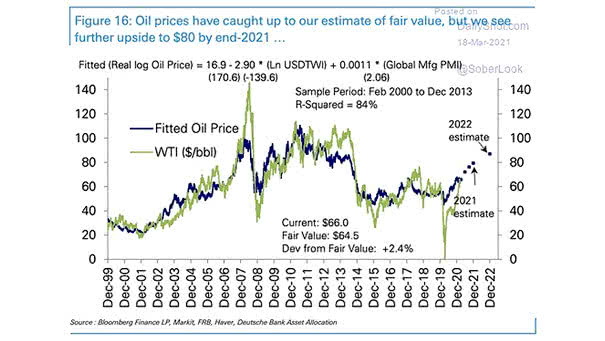
Oil Price Fair Value Oil is trading 56% above its estimated medium‑term fair value. Apart from the 2022 shock peak, the market has rarely looked this overbought, leaving room for downside if conditions normalize. Image:…
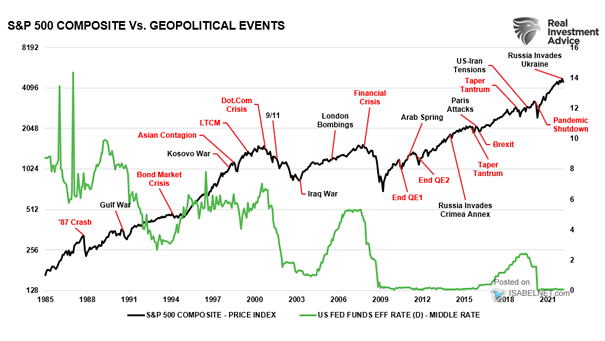
S&P 500 Around Major Geopolitical Events U.S. stocks have a habit of looking past turbulence in oil. After past geopolitical flare-ups, the S&P 500 has usually pushed higher, and this episode could follow the same…
Estimated Oil Exports Through Strait Hormuz, Based on Vessel Count Goldman Sachs has toughened its base case for the Strait of Hormuz, now expecting 21 days of minimal crude flows followed by a month‑long recovery…
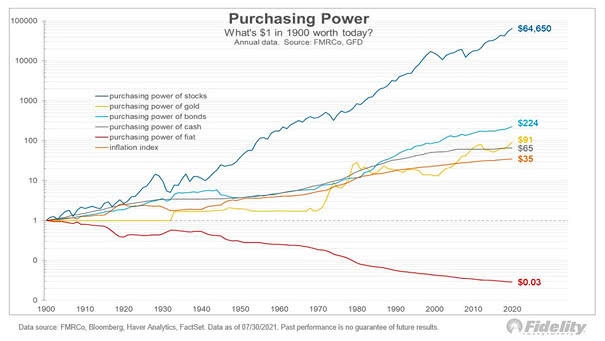
Purchasing Power of the U.S. Dollar (Measured by Inflation): Invested vs. Uninvested Gold hasn’t lost its glow, but U.S. stocks have shone brighter since 1928. Look far enough ahead, and the edge moves to assets…
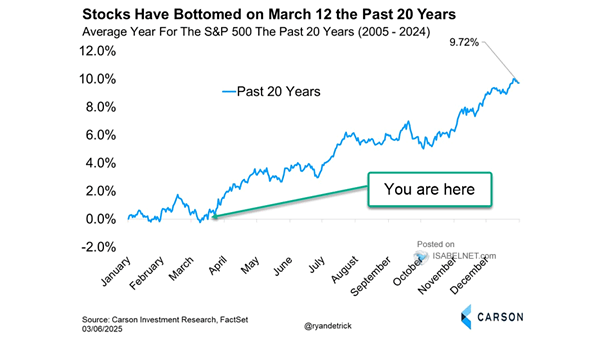
Average Year for the S&P 500 the Past 20 Years Over the past two decades, March 12 has often marked the bottom for U.S. stocks, with rebounds taking shape soon after. History doesn’t always repeat itself,…
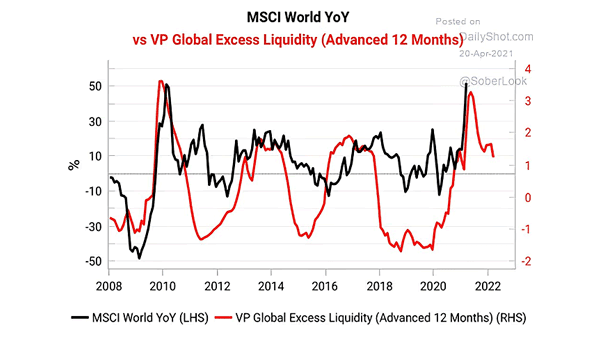
S&P 500 – MSCI U.S. vs. G10 Excess Liquidity (Leading Indicator) G10 excess liquidity, the gap between real money growth and economic growth, is climbing again as it returns to post‑pandemic highs and gives U.S.…
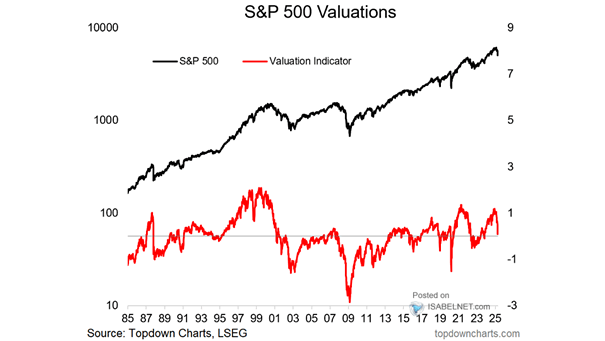
S&P 500 Sentiment and Valuations Cracks are emerging as S&P 500 sentiment and valuation indicators are slipping from stretched territory, a move investors should keep an eye on. Markets rarely stay overheated for long. Image:…