Following Quarter EPS Revisions Through Earnings Season
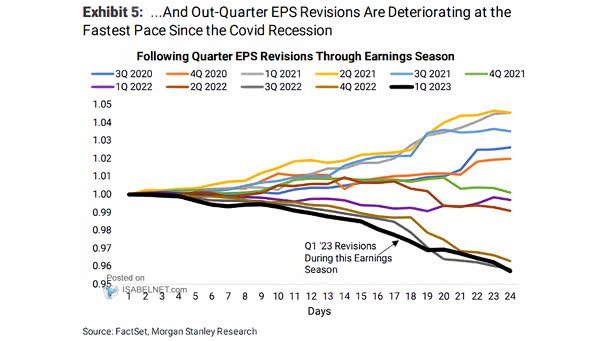
Following Quarter EPS Revisions Through Earnings Season EPS revisions are rapidly deteriorating. An earnings recession is currently not priced in by the market. Image: Morgan Stanley Research
Following Quarter EPS Revisions Through Earnings Season EPS revisions are rapidly deteriorating. An earnings recession is currently not priced in by the market. Image: Morgan Stanley Research
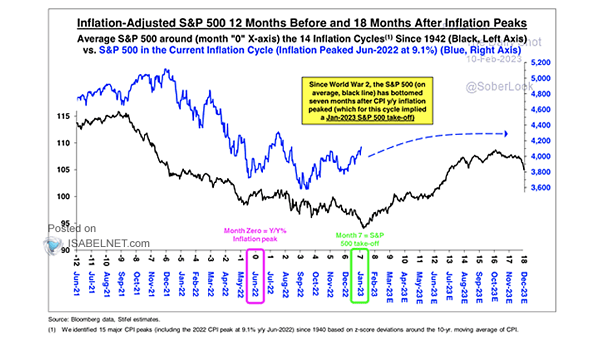
Inflation-Adjusted S&P 500 12 Months Before and 18 Months After Inflation Peaks Since WWII, the S&P 500 has bottomed seven months after the peak in CPI inflation. Image: Stifel
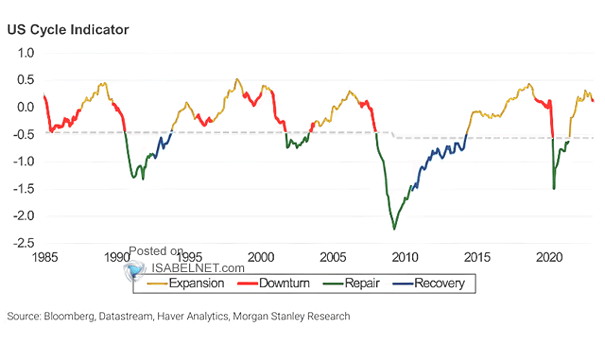
U.S. Business Cycle – Cross-Asset Cycle Indicator The Morgan Stanley’s U.S. cycle indicator has moved into the downturn phase. Should investors favor fixed income over equities? Image: Morgan Stanley Research
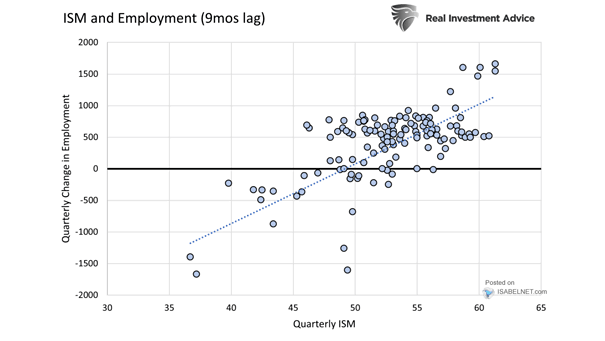
U.S. ISM Manufacturing Index and U.S. Employment It is important to keep a close eye on the U.S. ISM Manufacturing Index for any changes in U.S. employment.
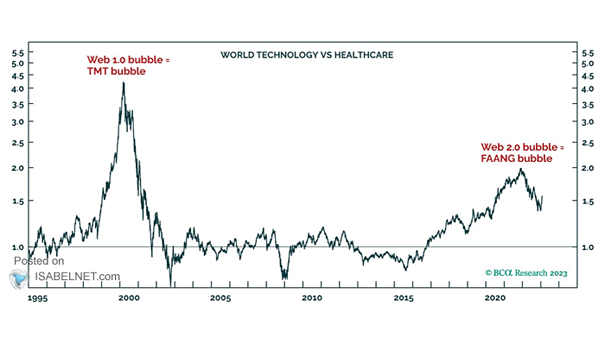
Performance – World Technology vs. Healthcare Is it the end of the FAANG bubble? Image: BCA Research
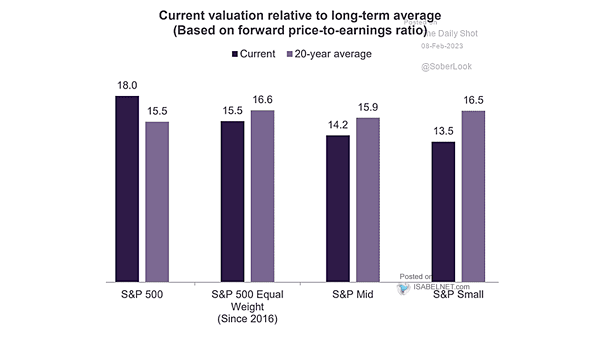
Current Valuation Relative to Long-term Average The S&P 500 Index remains historically expensive. Image: Truist
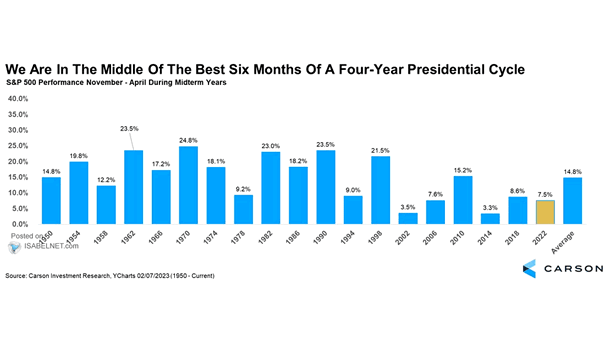
S&P 500 Performance November – April During Midterm Years Historically, the six months from November through April have seen the best performance for U.S. stocks following midterm elections. Image: Carson Investment Research
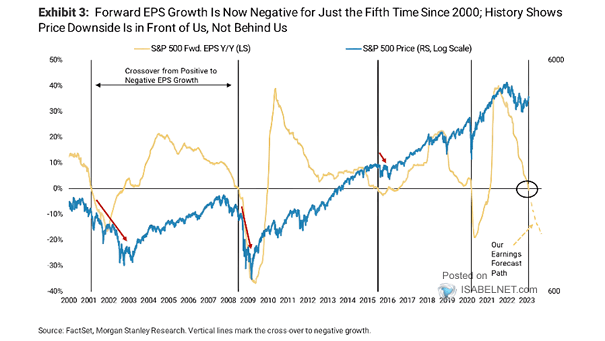
S&P 500 Forward EPS vs. S&P 500 Is there further downside ahead for the S&P 500, as an earnings recession is not priced into U.S. equities? Image: Morgan Stanley Research
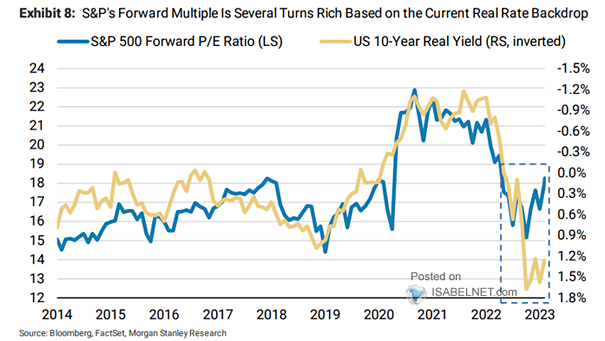
Valuation – 10-Year U.S. Treasury Real Yield vs. S&P 500 Forward Price/Earnings Ratio Despite higher real rates, the S&P 500’s valuation remains elevated. Image: Morgan Stanley Wealth Management
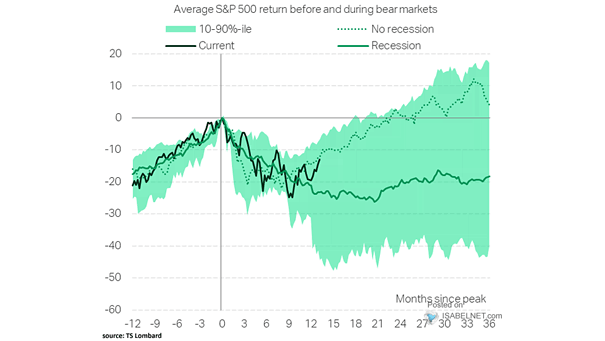
Average S&P 500 Return Before and During Bear Markets The S&P 500 does not price in a U.S. recession. Image: TS Lombard
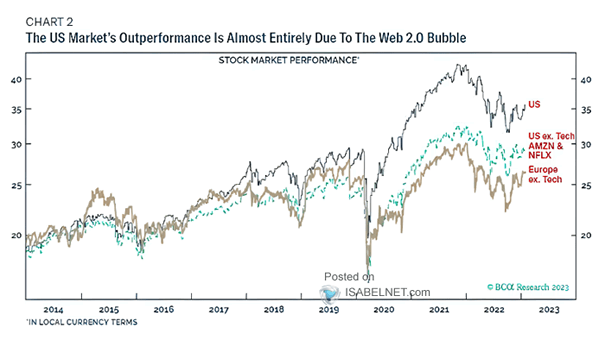
Stock Market Performance Is it the end of the web 2.0 bubble? Image: BCA Research