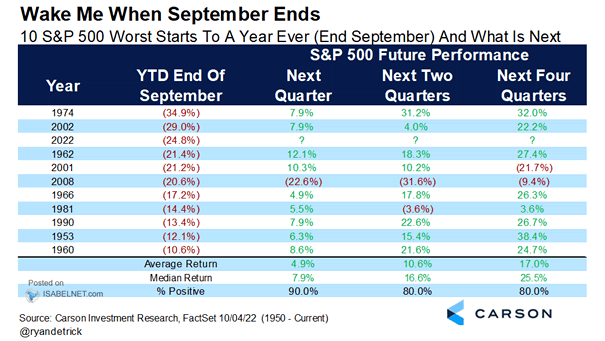
Global M2 and S&P 500 Index

Global M2 and S&P 500 Index The decrease in global liquidity is potentially bad news for U.S. equity returns. Image: Morgan Stanley Research

S&P 500 and Deviation from 200-Day Moving Average

S&P 500 and Deviation from 200-Day Moving Average Historically, a 20% drop below the 200-day moving average of the S&P 500 tends to be a good entry point for long-term investors. Image: BofA Global Investment…

U.S. Equities – NYSE Composite Index

U.S. Equities – NYSE Composite Index Will the break below 14,000 for the NYSE Composite Index intensify the sell-off toward the 2018 lows at 11,000? Image: BofA Global Investment Strategy

Annual U.K. Equities Flows

Annual U.K. Equities Flows Bye-bye U.K. stocks? U.K. stock outflows are on track for the worst year ever. Image: BofA Global Investment Strategy

Gold Price vs. 10-Year Real Rates

Gold Price vs. 10-Year Real Rates Gold is still tracking changes in 10-year U.S. real rates. Image: Goldman Sachs Global Investment Research