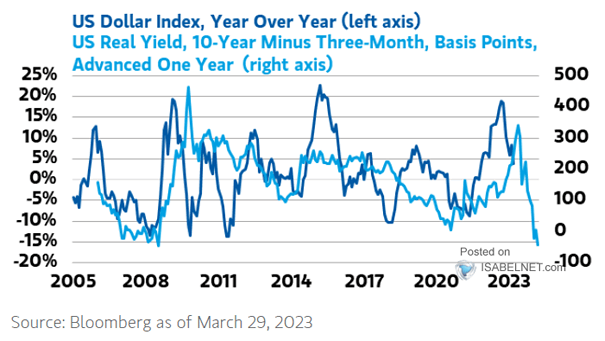
EM Currencies vs U.S. Dollar – Market Breadth
EM Currencies vs U.S. Dollar – Market Breadth The bullish breadth divergence suggests a potential upside among EM currencies. Image: Topdown Charts
FMS Cash Balance and S&P 500 FMS cash levels jumped to 5.3% in February, which is contrarian bullish. Image: BofA Global Fund Manager Survey
Median Sell-Off on Earnings Misses U.S. companies that missed their earnings estimates have been severely punished. Image: Deutsche Bank
Valuation – MSCI Europe 12-Month Forward P/E Valuation is back to pre-pandemic levels for European stocks. Image: Deutsche Bank Asset Allocation
FMS Investors – Net % Thinking Late-Cycle Are the conditions for a late cycle met? Image: BofA Global Fund Manager Survey
Cumulative Bond Flows Are bonds still the place to be in 2022? Image: Deutsche Bank Asset Allocation
Valuation – S&P 500 12-Month Forward P/E Ratio and 2-Year U.S. Treasury Yield Historically, rising rates tend to compress S&P 500 valuation multiples. Image: Alpine Macro
10-Year Government Bond Yield Will global 10-year government bond yields continue to rise? Image: Morgan Stanley Wealth Management
Total Equity Flows Minus Bond Flows and U.S. 10-Year Yield Will the rotation in fund flows from bonds to equities continue? Image: Deutsche Bank Asset Allocation
Wage Growth vs. Fed Funds Wage growth suggests the Fed is significantly behind the curve. Image: Topdown Charts