Cumulative Flows into Equity by Regions
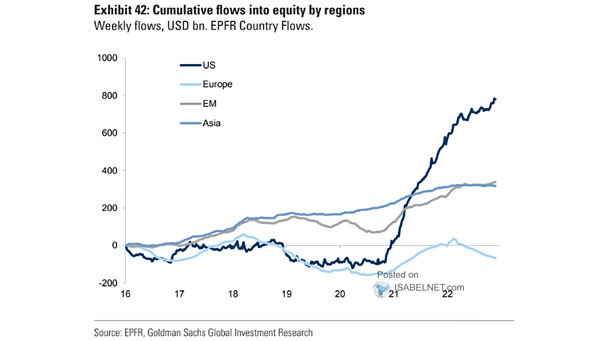
Cumulative Flows into Equity by Regions Flows into U.S. equities remain strong. Image: Goldman Sachs Global Investment Research
Cumulative Flows into Equity by Regions Flows into U.S. equities remain strong. Image: Goldman Sachs Global Investment Research
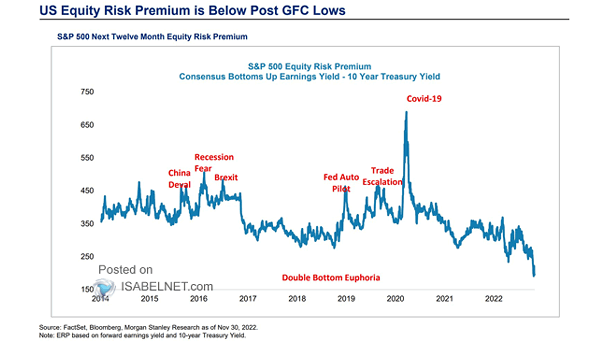
S&P 500 Equity Risk Premium – Consensus Bottoms Up Earnings Yield – 10-Year Treasury Yield Can U.S. Treasury bonds be considered more attractive than U.S. stocks at present? Image: Morgan Stanley Research
Atlanta Fed YoY Wage Growth Tracker So far, wage growth in the United States remains strong and historically high. Image: BofA Global Investment Strategy
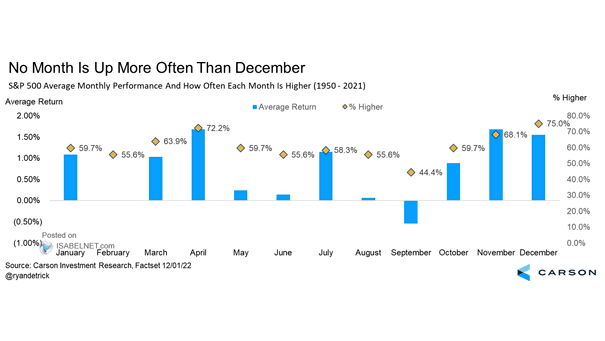
S&P 500 Average Monthly Performance and How Often Each Month is Higher Since 1950, the S&P 500 has posted positive results 75% of the time in December, which is the highest percentage of any month.…
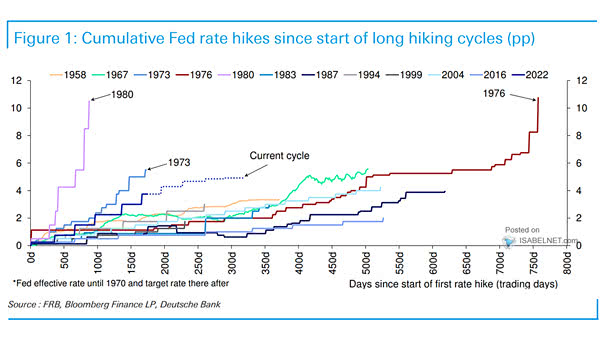
Cumulative Fed Rate Hikes Since Start of Long Hiking Cycles Could smaller rate hikes continue for longer? Image: Deutsche Bank
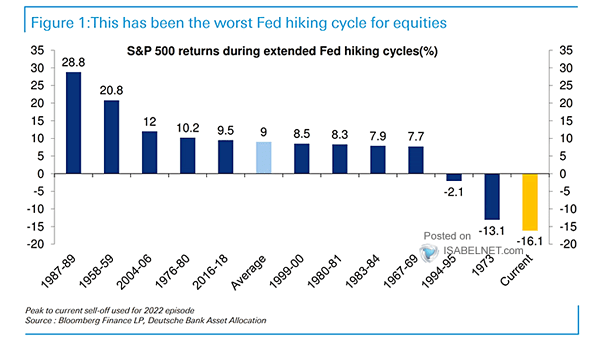
S&P 500 Returns During Extended Fed Hiking Cycles Historically, rate hike cycles tend to be positive for U.S. stocks. But that’s not the case this year. Image: Deutsche Bank Asset Allocation
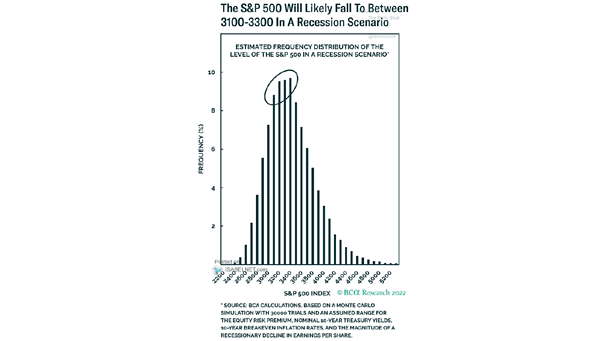
Estimated Frequency Distribution of the Level of S&P 500 in a Recession Scenario Will the S&P 500 fall to 3100-3300 in the event of a U.S. recession? Image: BCA Research
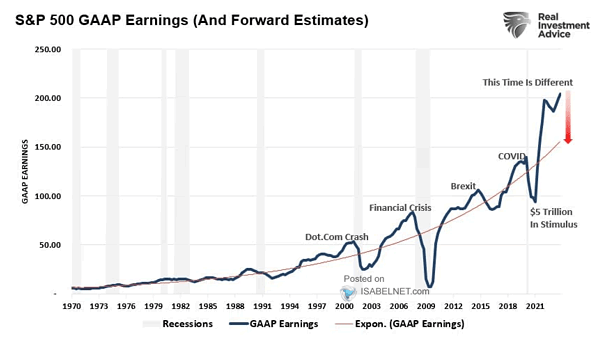
S&P 500 GAAP Earnings (and Forward Estimates) Reversion to the mean is a powerful force. Should U.S. equity investors expect earnings to fall significantly? Image: Real Investment Advice
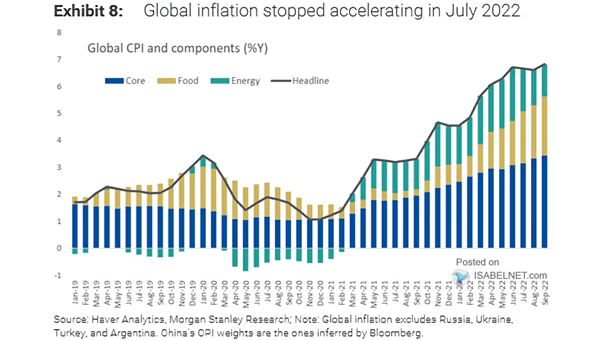
Inflation – Global CPI and Components Is global inflation close to peaking? Image: Morgan Stanley Research
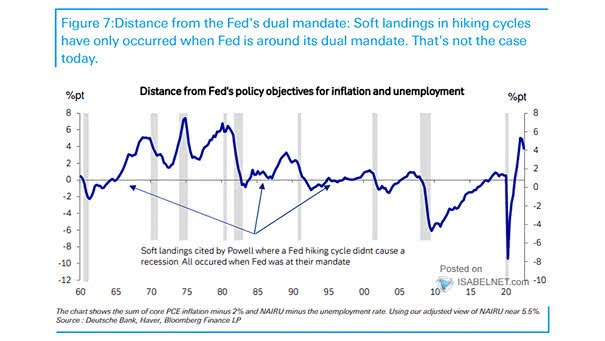
Distance from Fed’s Policy Objectives for Inflation and Unemployment Is the U.S. economy headed for a hard landing? Image: Deutsche Bank
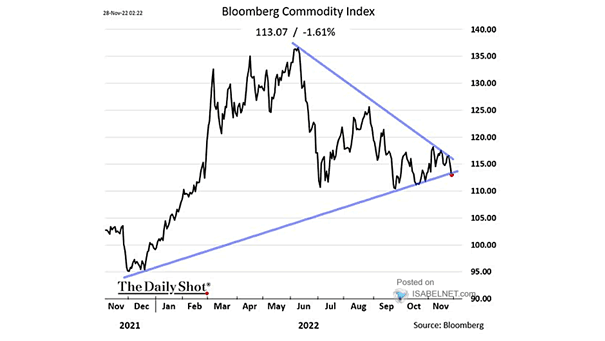
Commodities – Bloomberg Commodity Index Will commodity prices continue to fall along with inflation? Image: The Daily Shot