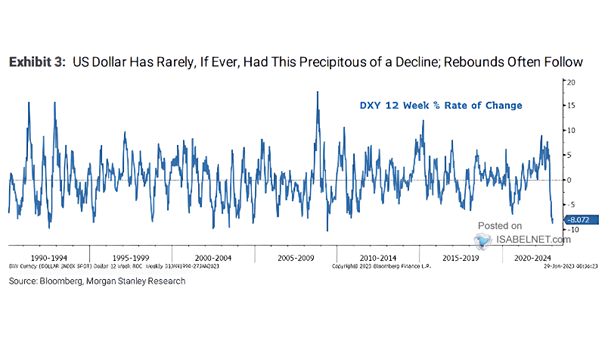
U.S. Dollar Index – DXY 12-Week % Rate of Change
U.S. Dollar Index – DXY 12-Week % Rate of Change Should investors expect the U.S. dollar to remain relatively strong in the near-term despite recent volatility? Image: Morgan Stanley Research
U.S. Dollar Index – DXY 12-Week % Rate of Change Should investors expect the U.S. dollar to remain relatively strong in the near-term despite recent volatility? Image: Morgan Stanley Research
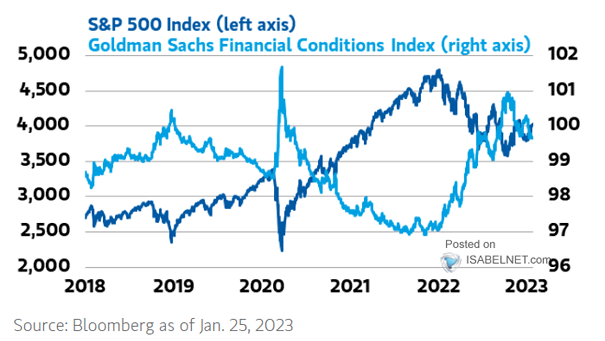
S&P 500 Index vs. Financial Conditions Index Should investors forget Goldilocks, as it’s all about financial conditions? Image: Morgan Stanley Wealth Management
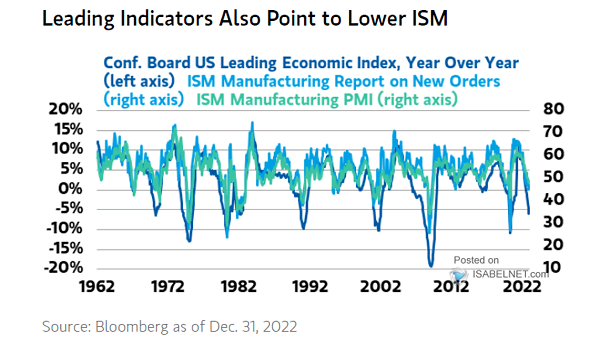
Conference Board U.S. Leading Economic Index vs. ISM Manufacturing New Orders vs. ISM Manufacturing PMI The current reading of the U.S. LEI could result in lower ISM in the next few months. Image: Morgan Stanley…
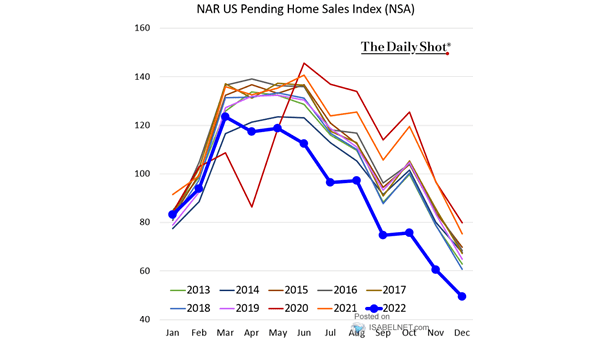
NAR U.S. Pending Home Sales Index U.S. pending home sales dropped by 33.8% YoY in December. Image: The Daily Shot
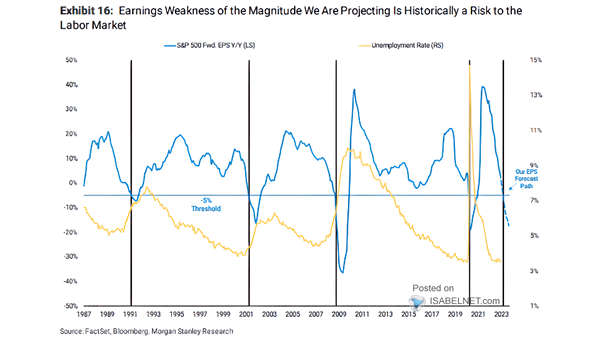
S&P 500 Forward EPS vs. U.S. Unemployment Rate Weakness in S&P 500 earnings is a potential indicator of a higher U.S. unemployment rate. Image: Morgan Stanley Research
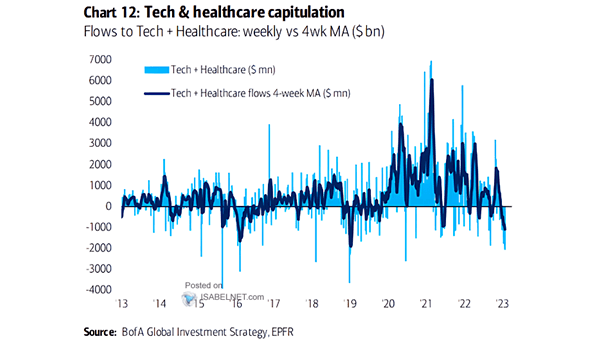
Tech + Healthcare Flows Outflows from tech and healthcare persist. Image: BofA Global Investment Strategy
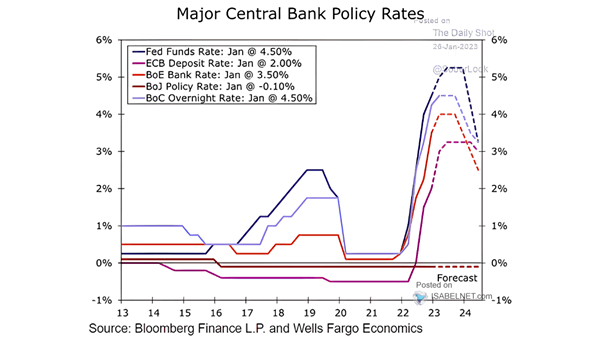
Major Central Bank Policy Rates The peak in interest rates among major central banks is yet to come. Image: Wells Fargo Economics
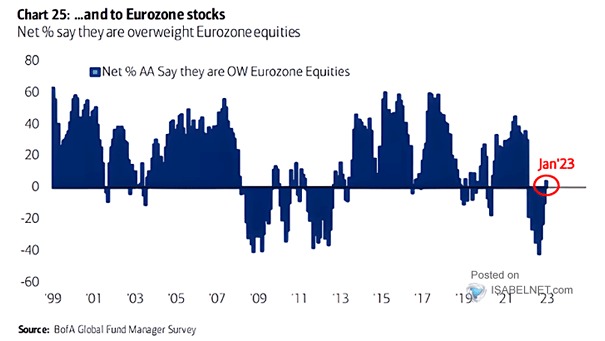
FMS Investors – Net % Say They Are Overweight Eurozone Equities Should investors overweight eurozone equities in their portfolio? Image: BofA Global Investment Strategy
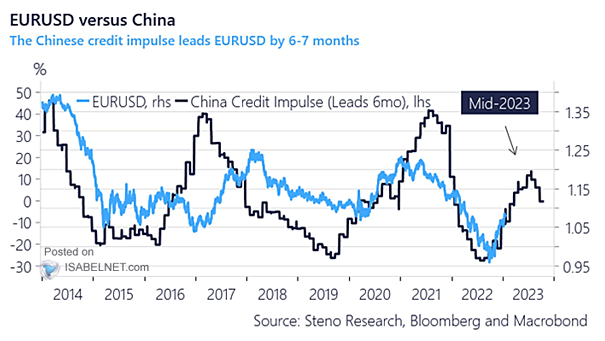
China Credit Impulse and Euro to U.S. Dollar (EUR/USD) – Leading Indicator Will EUR/USD peak in mid-2023? Image: Steno Research
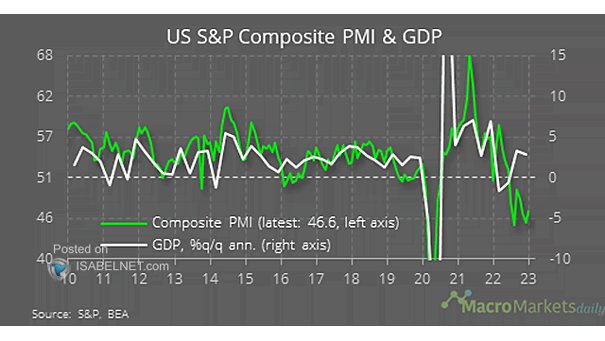
U.S. S&P Composite PMI and GDP The U.S. S&P Composite PMI suggests that the U.S. economy could be headed for a period of contraction. Image: Macro Markets Daily
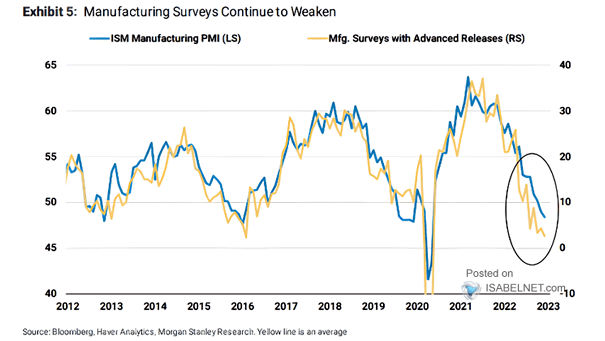
U.S. ISM Manufacturing PMI vs. Manufacturing Surveys with Advanced Releases Will the U.S. manufacturing sector struggle to recover in the near-term? Image: Morgan Stanley Research