FMS Tech Net Allocation
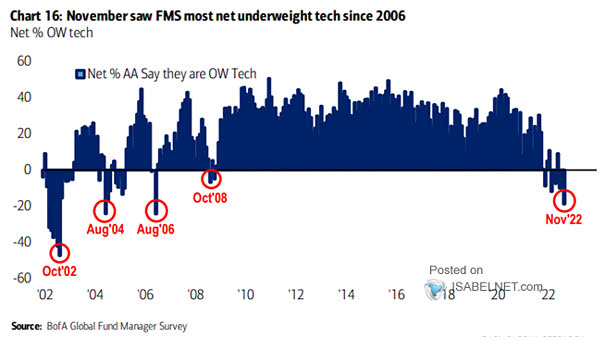
FMS Tech Net Allocation Bye-bye tech? Tech net allocation fell to the lowest level since August 2006. Image: BofA Global Fund Manager Survey
FMS Tech Net Allocation Bye-bye tech? Tech net allocation fell to the lowest level since August 2006. Image: BofA Global Fund Manager Survey
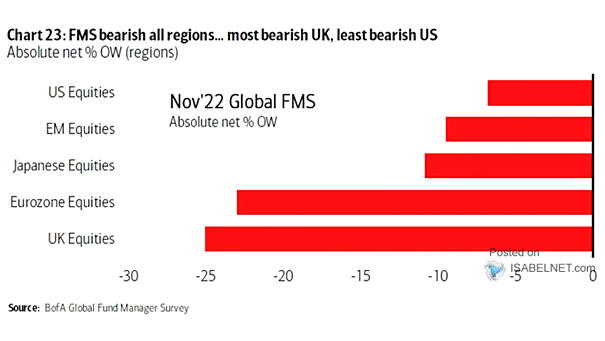
FMS Investors and Equities – Absolute Net % OW FMS investors remain bearish on stocks. Image: BofA Global Fund Manager Survey
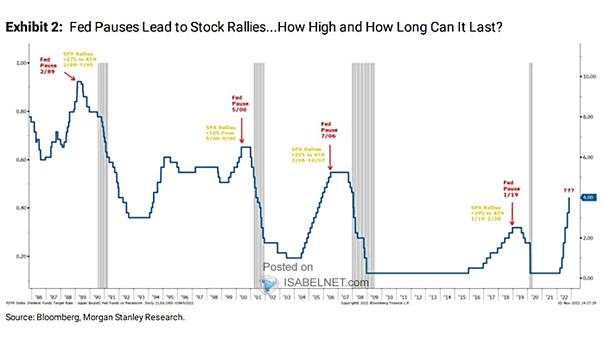
Fed Pause Before a Recession Fed pauses tend to be positive for stocks, but Fed cuts are negative before a recession. Image: Morgan Stanley Research
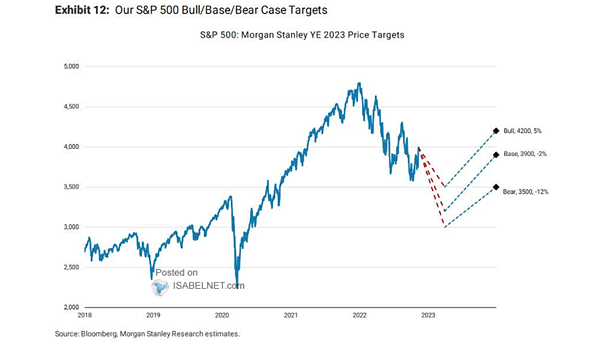
S&P 500 Forward 12-Month Price Targets Morgan Stanley expects the S&P 500 to reach 3,900 by year-end 2023 (base case scenario). Image: Morgan Stanley Research
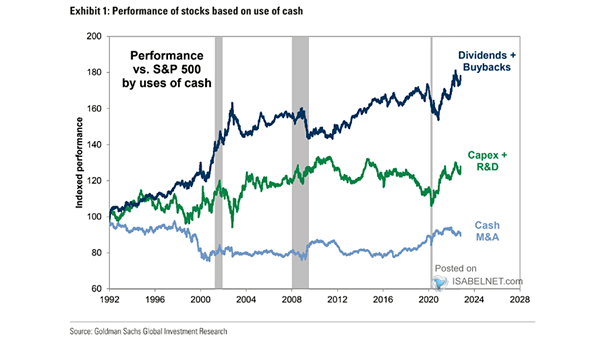
Performance vs. S&P 500 by Uses of Cash U.S. companies that spend the most cash on dividends and buybacks have outperformed the S&P 500 since 1992. Image: Goldman Sachs Global Investment Research
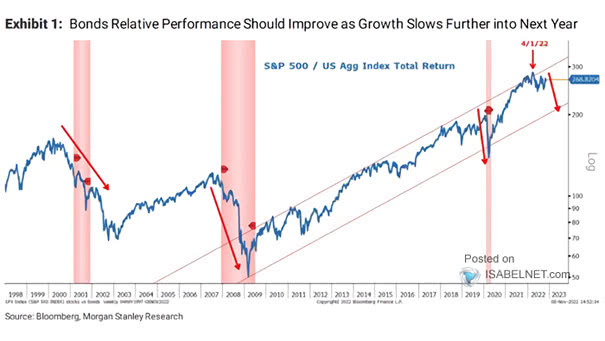
S&P 500 / U.S. Aggregate Bond Index Total Return Will bonds outperform stocks in 2023 as U.S. growth slows further? Image: Morgan Stanley Research
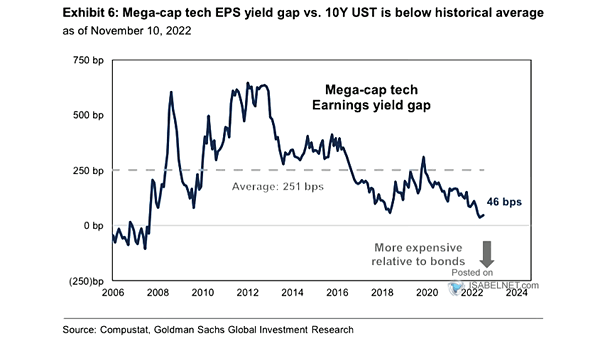
Mega-Cap Tech Earnings Yield Gap How long will the mega-cap tech earnings yield gap vs. 10-year UST remain below the historical average? Image: Goldman Sachs Global Investment Research
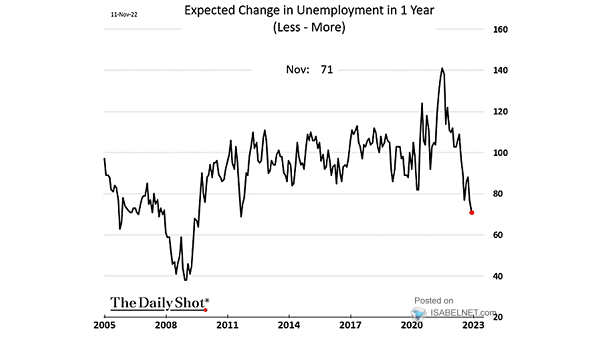
Expected Change in U.S. Unemployment in 1 Year How much will U.S. unemployment rise in 2023? Image: The Daily Shot
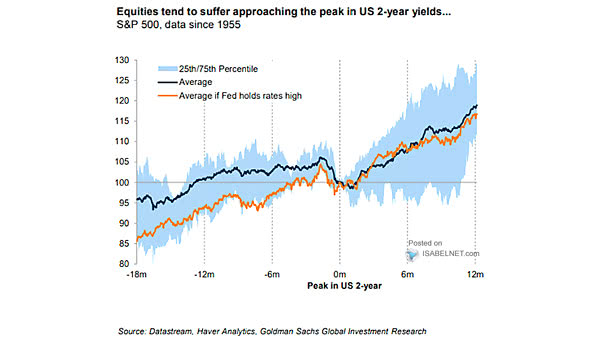
S&P 500 and Peak in U.S. 2-Year Yields Should investors expect the S&P 500 to rebound after the peak in U.S. 2-year yields? Image: Goldman Sachs Global Investment Research
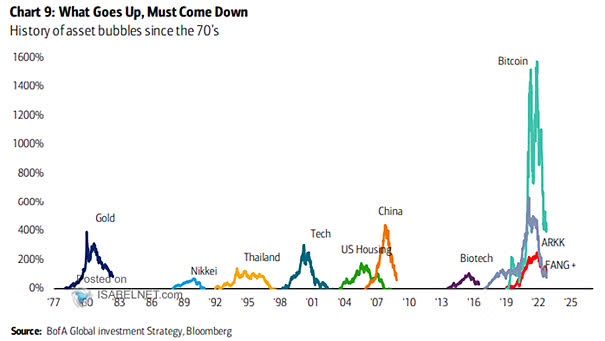
Bitcoin, the Mother of All Bubbles? Is Bitcoin the biggest bubble in the history of mankind? Image: BofA Global Investment Strategy
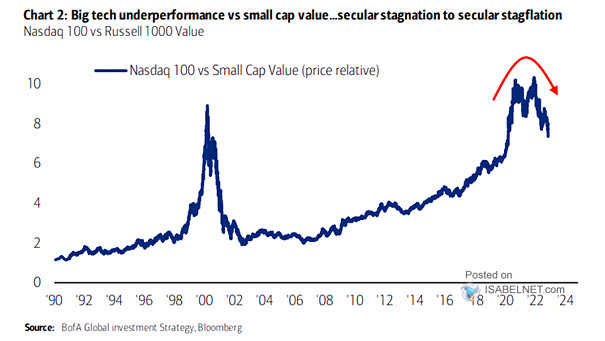
Performance – Nasdaq 100 vs. Russell 1000 Value Will small-cap value continue to outperform big tech? Image: BofA Global Investment Strategy