S&P 500 – Cross-Asset Correlations
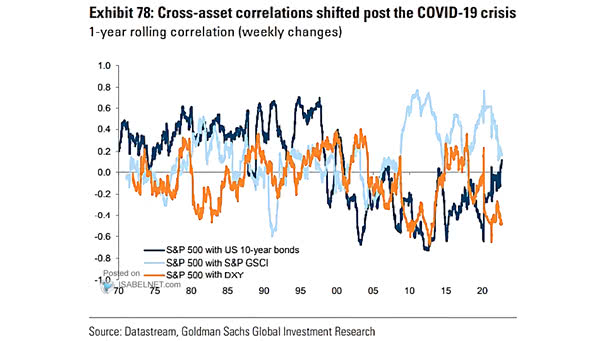
S&P 500 – Cross-Asset Correlations So far, the S&P 500 remains inversely correlated with the U.S. dollar and positively correlated with U.S. 10-year bonds. Image: Goldman Sachs Global Investment Research
S&P 500 – Cross-Asset Correlations So far, the S&P 500 remains inversely correlated with the U.S. dollar and positively correlated with U.S. 10-year bonds. Image: Goldman Sachs Global Investment Research
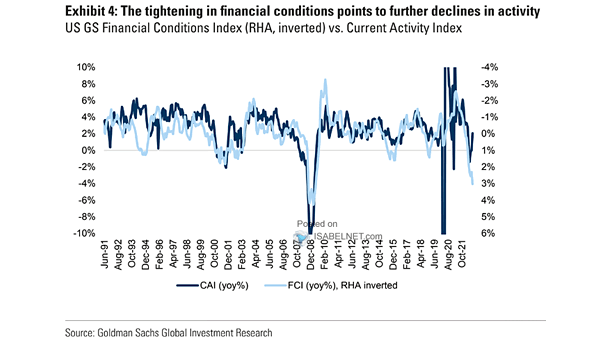
U.S. GS Financial Conditions Index vs. Current Activity Index The tightening in financial conditions does not bode well for activity. Image: Goldman Sachs Global Investment Research
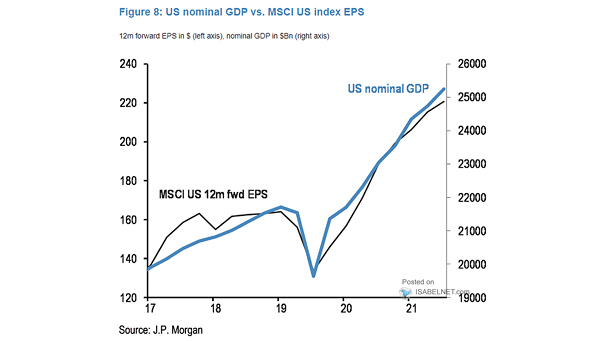
Earnings – MSCI U.S. 12-Month EPS and U.S. Nominal GDP 12-month forward EPS and U.S. nominal GDP have a strong relationship. Image: J.P. Morgan
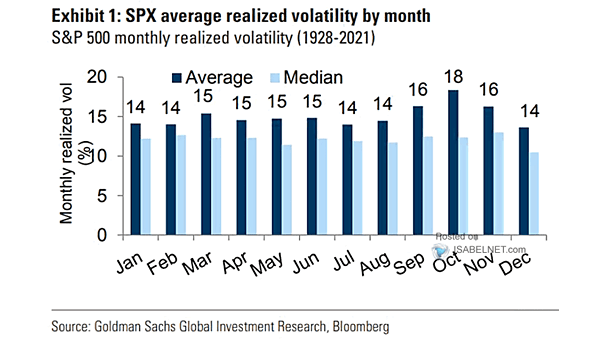
S&P 500 Average Stock Realized Volatility by Month October has traditionally been the most volatile month for U.S. stocks. Image: Goldman Sachs Global Investment Research
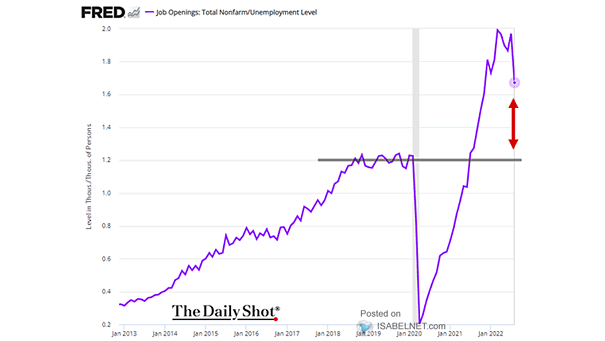
U.S. Labor Market – U.S. Job Openings U.S. job openings are declining but remain very high. Are investors overly optimistic about a dovish Fed pivot? Image: The Daily Shot
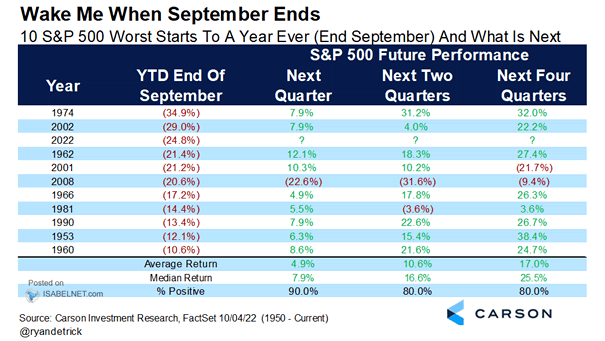
Performance – 10 S&P 500 Worst Starts to a Year Ever (End September) and What Is Next Should U.S. equity investors be optimistic about the fourth quarter? Image: Carson Investment Research
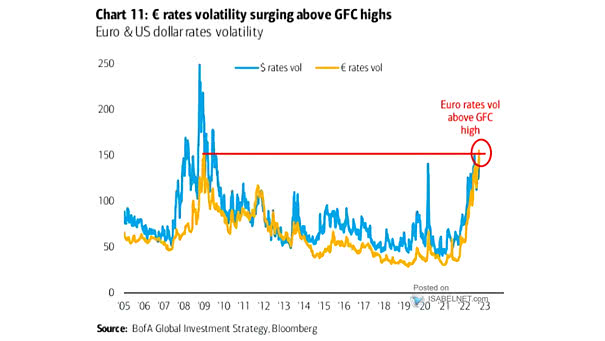
Euro and U.S. Dollar Rates Volatility Euro rates volatility is above GFC highs. Image: BofA Global Investment Strategy
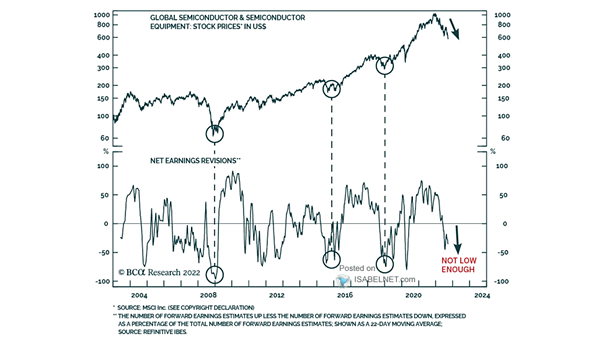
Stocks – Global Semiconductor and Semiconductor Equipment Should investors expect global semiconductor stocks continue to fall? Image: BCA Research
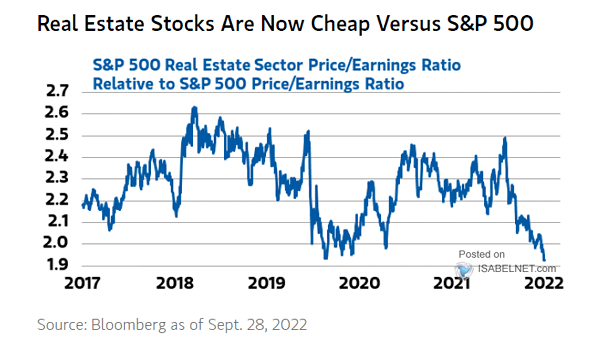
Valuation – S&P 500 Real Estate Sector P/E Ratio vs. S&P 500 P/E Ratio Real estate stocks look attractive relative to the S&P 500. Image: Morgan Stanley Wealth Management
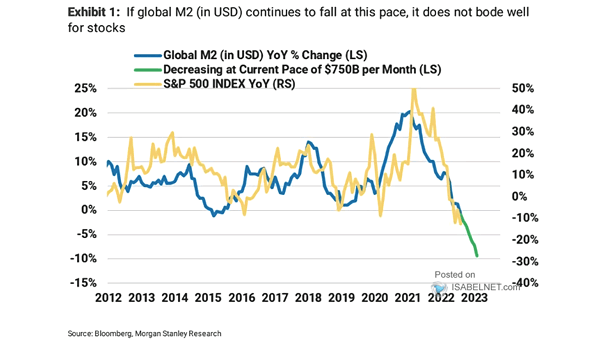
Global M2 and S&P 500 Index The decrease in global liquidity is potentially bad news for U.S. equity returns. Image: Morgan Stanley Research
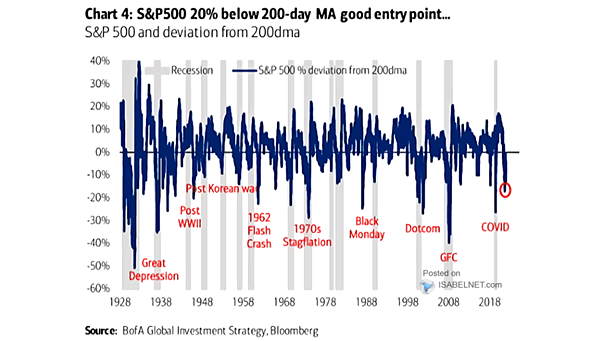
S&P 500 and Deviation from 200-Day Moving Average Historically, a 20% drop below the 200-day moving average of the S&P 500 tends to be a good entry point for long-term investors. Image: BofA Global Investment…