U.S. Equities – NYSE Composite Index
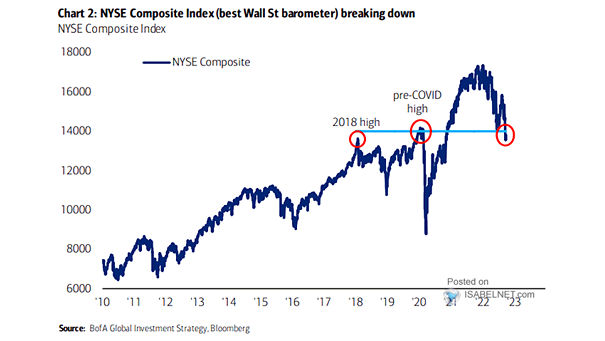
U.S. Equities – NYSE Composite Index Will the break below 14,000 for the NYSE Composite Index intensify the sell-off toward the 2018 lows at 11,000? Image: BofA Global Investment Strategy
U.S. Equities – NYSE Composite Index Will the break below 14,000 for the NYSE Composite Index intensify the sell-off toward the 2018 lows at 11,000? Image: BofA Global Investment Strategy
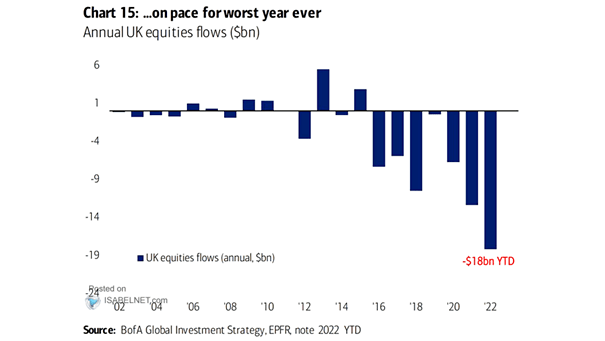
Annual U.K. Equities Flows Bye-bye U.K. stocks? U.K. stock outflows are on track for the worst year ever. Image: BofA Global Investment Strategy
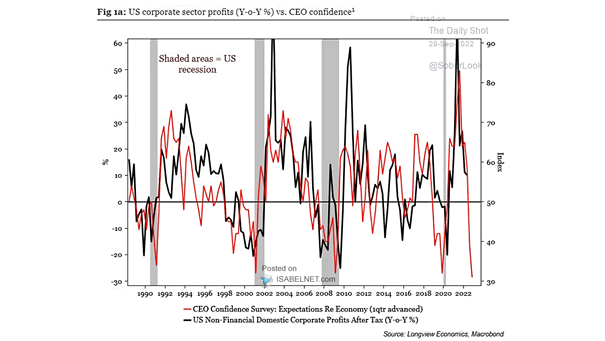
U.S. Corporate Sector Profits vs. CEO Confidence Weak CEO confidence suggests that U.S. corporate profits are at risk. Image: Longview Economics
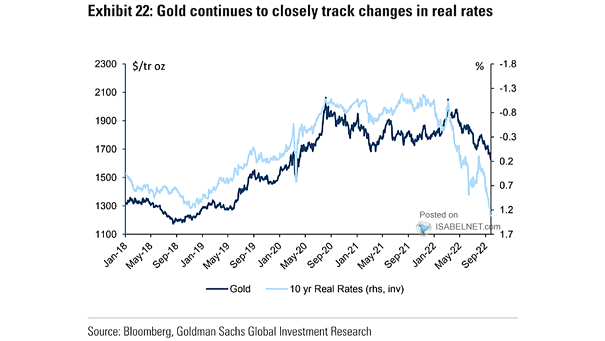
Gold Price vs. 10-Year Real Rates Gold is still tracking changes in 10-year U.S. real rates. Image: Goldman Sachs Global Investment Research
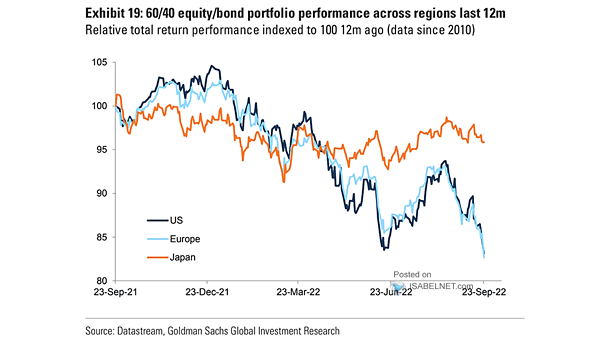
60/40 Equity/Bond Portfolio Performance Across Regions Will the 60/40 portfolio make a comeback eventually? Image: Goldman Sachs Global Investment Research
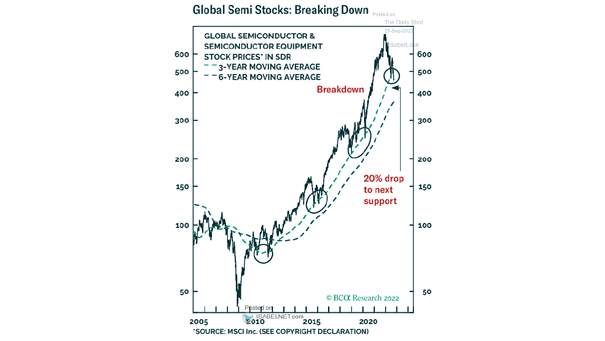
Global Semiconductor Stocks Will global semiconductor stocks keep falling? Image: BCA Research
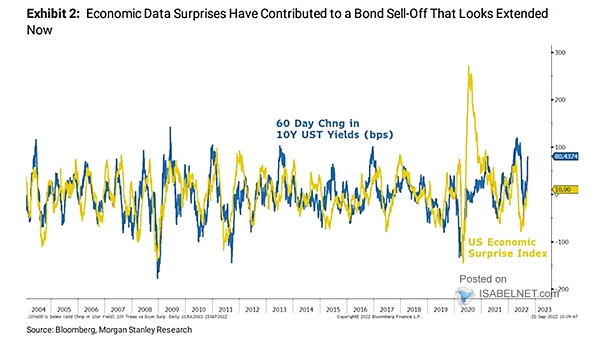
U.S. Economic Surprise Index vs. 60 Day Change in 10-Year U.S. Treasury Yields Is the worst of the bond sell-off over? Image: Morgan Stanley Research
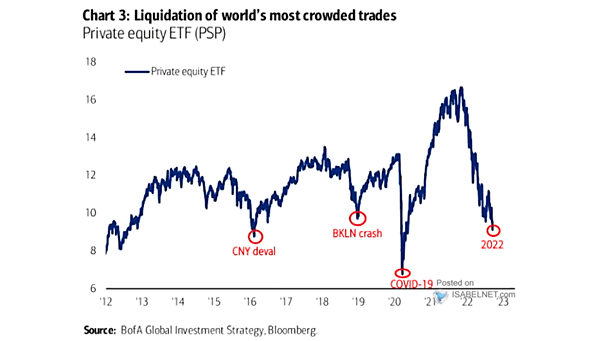
Private Equity ETF Private equity, after soaring, is returning back to earth. Image: BofA Global Investment Strategy
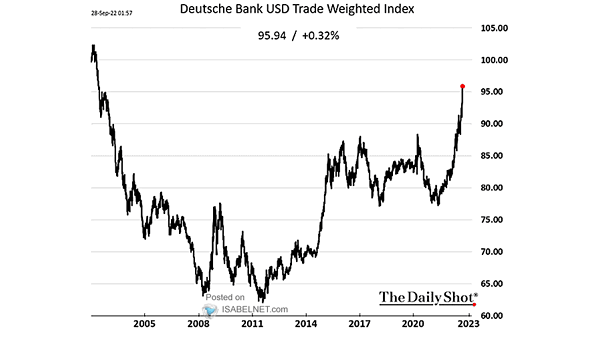
U.S. Dollar – Deutsche Bank USD Trade Weighted Index Is the U.S. dollar on the way to the moon? Image: The Daily Shot
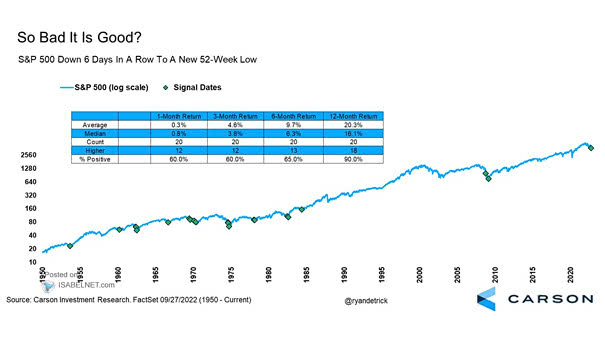
S&P 500 Down 6 Days in a Row to a New 52-Week Low When the S&P 500 is down 6 days in a row to a new 52-week low, it tends to be bullish over…
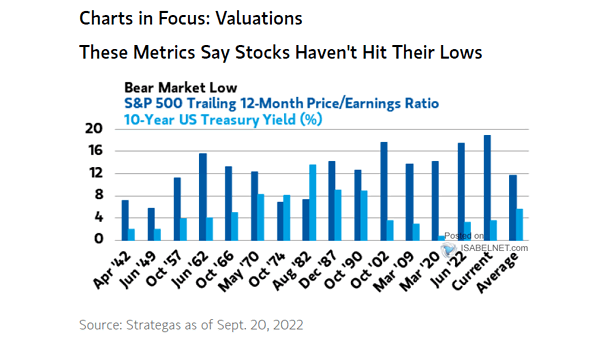
Bear Market Low – S&P 500 Trailing 12-Month P/E Ratio and 10-Year UST Yield Should U.S. equity investors expect the bear market to continue? Image: Morgan Stanley Wealth Management