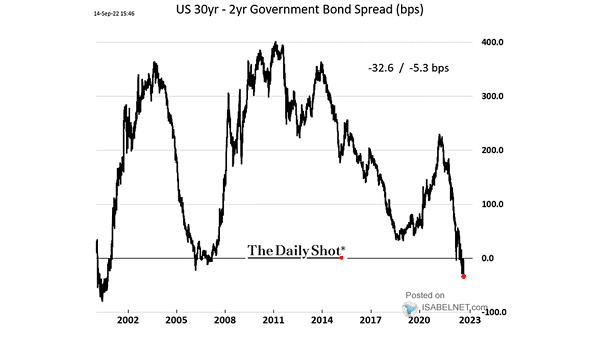
Yield Curve – U.S. 30-Year – 2-Year Government Bond Spread
Yield Curve – U.S. 30-Year – 2-Year Government Bond Spread The 30Y-2Y inverted yield curve does not bode well for the U.S. economy. Image: The Daily Shot
Yield Curve – U.S. 30-Year – 2-Year Government Bond Spread The 30Y-2Y inverted yield curve does not bode well for the U.S. economy. Image: The Daily Shot
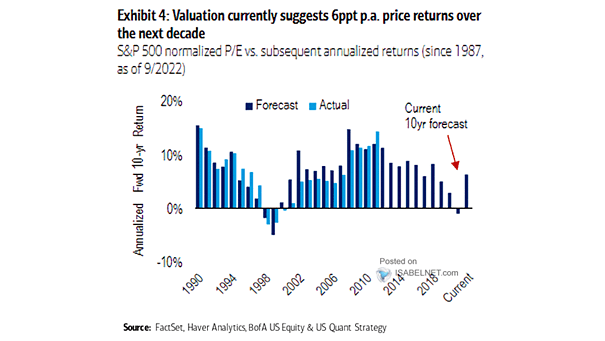
S&P 500 Normalized P/E vs. Subsequent Annualized Returns The current S&P 500 valuation suggests that equity investors should expect 6%/year over the next 10 years. Image: BofA US Equity & Quant Strategy
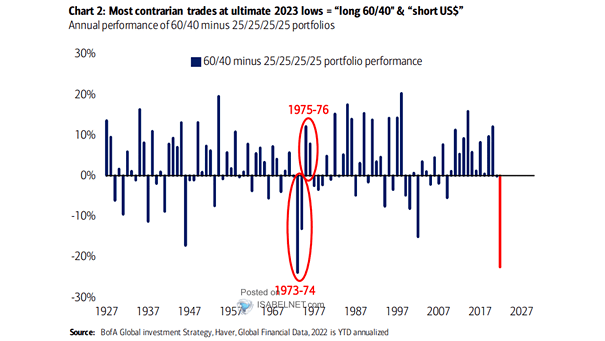
Annual Performance of 60/40 Minus 25/25/25/25 Portfolios This week is probably not the ultimate low of the U.S. stock market. Image: BofA Global Research
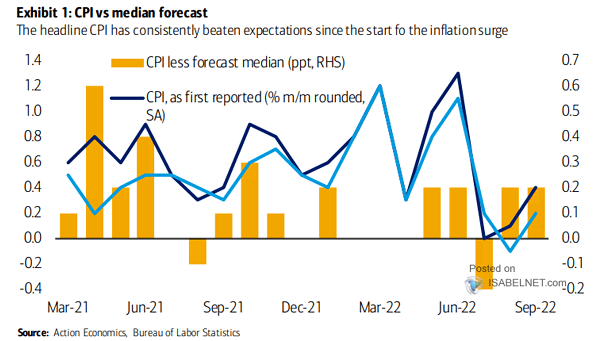
Inflation – U.S. CPI vs. Median Forecast Will U.S. headline CPI continue to surprise to the upside? Image: BofA Global Research
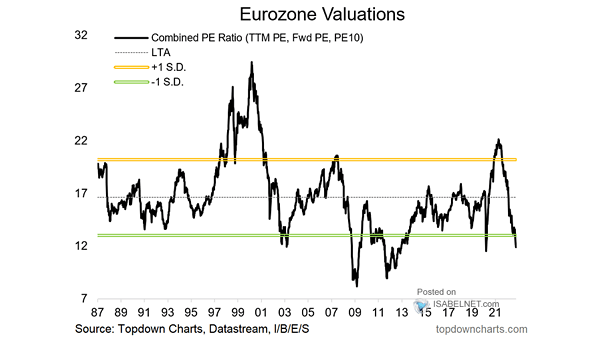
Eurozone Valuations Could european equities become even cheaper? Image: Topdown Charts
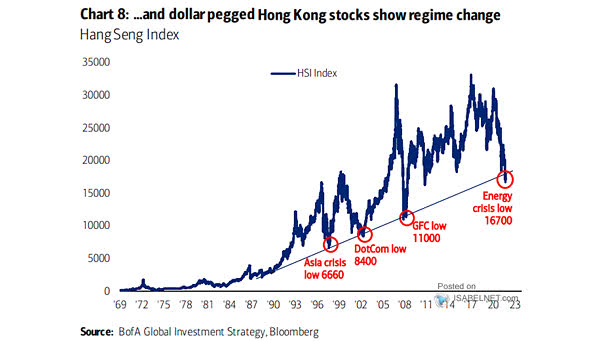
Market – Hang Seng Index The Hang Seng Index broke its long-term uptrend, which is not good news. Image: BofA Global Investment Strategy
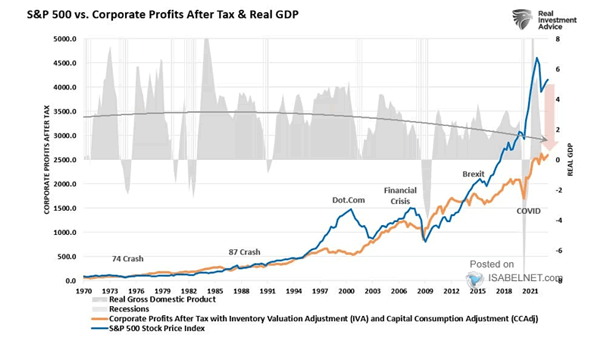
Corporate Profits After Tax vs. S&P 500 The gap between the S&P 500 and corporate profits after tax remains wide. Has the S&P 500 more room to fall? Image: Real Investment Advice
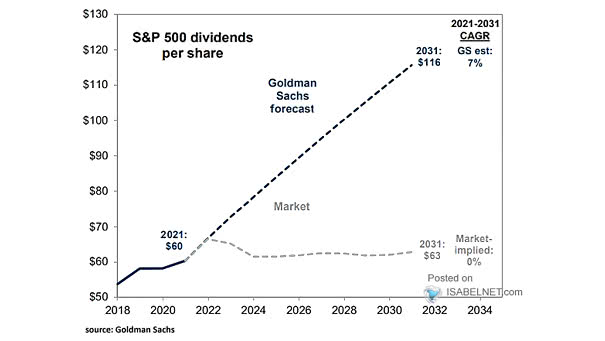
S&P 500 Dividends per Share Goldman Sachs expects a 10-year compound annual growth rate of 7% for S&P 500 dividends. Image: Goldman Sachs Global Investment Research
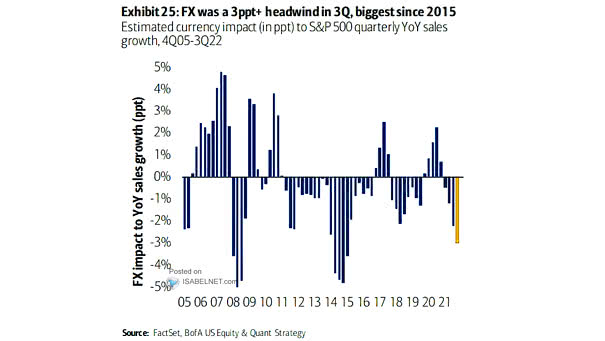
Estimated Currency Impact to S&P 500 YoY Sales Growth A strong U.S. dollar does not bode well for U.S. firms sales. Image: BofA US Equity & Quant Strategy
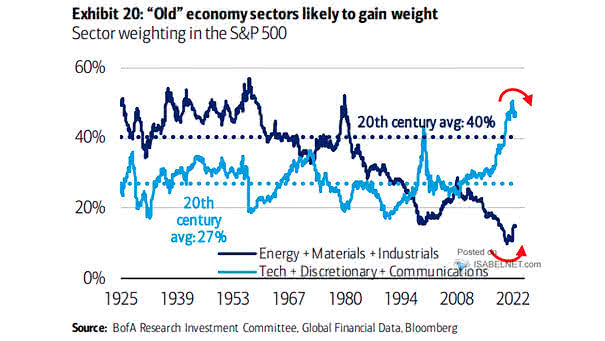
Sector Weighting in the S&P 500 Should investors overweight the “old” economy sectors? Image: BofA Research Investment Committee
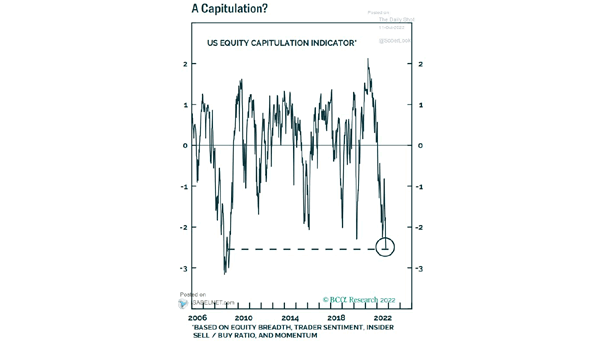
U.S. Equity Capitulation Indicator The odds of a capitulation in U.S. equities are increasing. Image: BCA Research