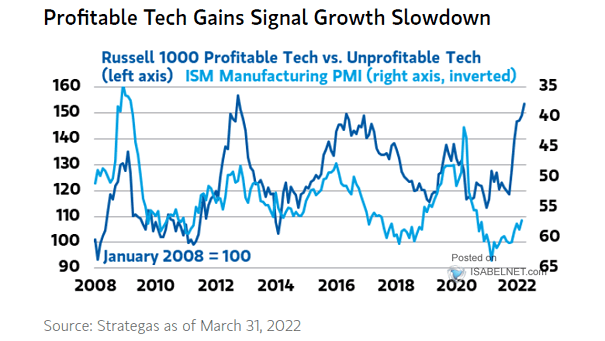
Russell 1000 Profitable Tech vs. Unprofitable Tech and ISM Manufacturing PMI
Russell 1000 Profitable Tech vs. Unprofitable Tech and ISM Manufacturing PMI Profitable tech gains suggest growth slowdown. Image: Morgan Stanley Wealth Management
Russell 1000 Profitable Tech vs. Unprofitable Tech and ISM Manufacturing PMI Profitable tech gains suggest growth slowdown. Image: Morgan Stanley Wealth Management
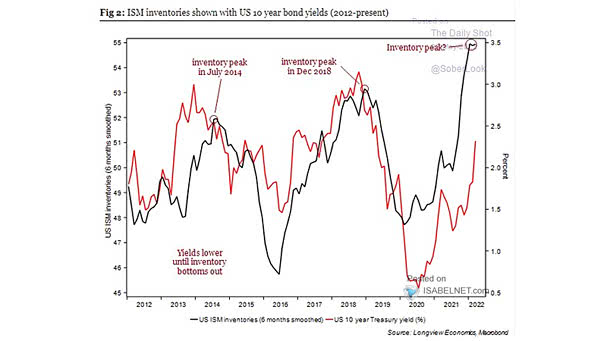
U.S. ISM Inventories vs. U.S. 10-Year Treasury Yield Has the U.S. 10-year Treasury yield peaked? Image: Longview Economics
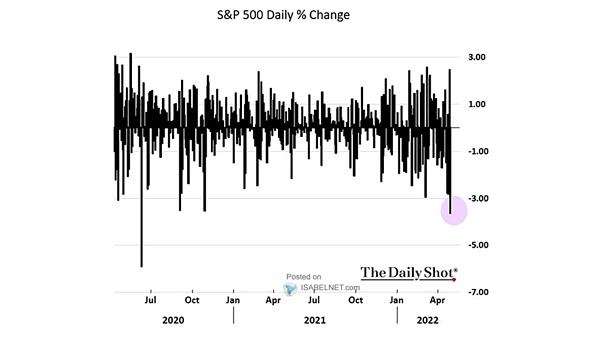
S&P 500 Daily % Change Will it take some time for the S&P 500 to stabilise? Image: The Daily Shot
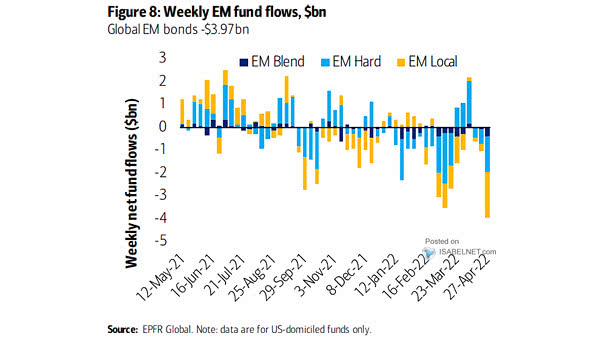
Weekly EM Fund Flows – Global EM Bonds Outflows from global EM bonds are strong. Image: BofA Global Research
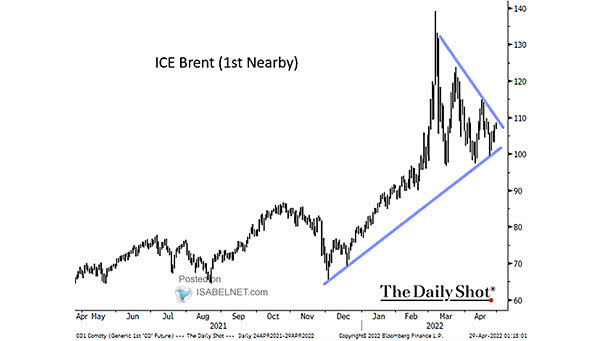
Brent Crude Oil Is brent crude oil going to break to the upside? Image: The Daily Shot
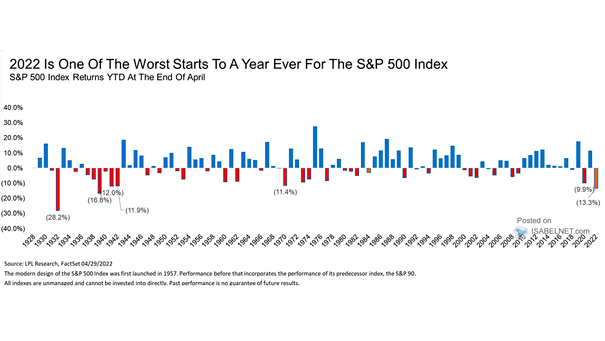
S&P 500 Index Returns YTD at the End of April Will the rest of the year be much better than average for the S&P 500? Image: LPL Research
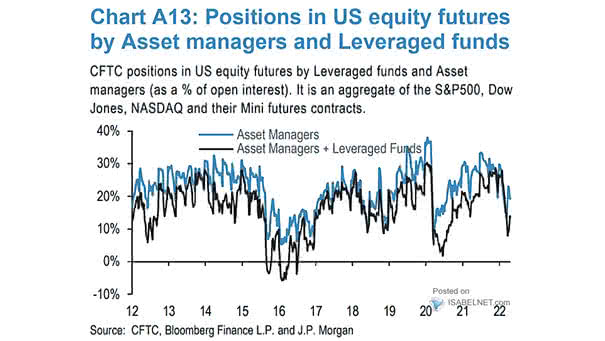
Positions in U.S. Equity Futures by Asset Managers and Leveraged Funds Asset managers and leveraged funds have decreased their long positions in U.S. equity futures since the beginning of the year. Image: J.P. Morgan
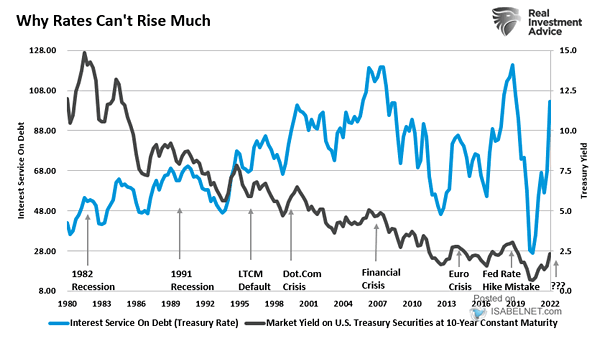
Interest Service On Debt (Treasury Rate) and Market Yield on U.S. Treasury Securities at 10-Year Constant Maturity Could the Fed’s rate hikes lead to a federal debt crisis? Image: Real Investment Advice
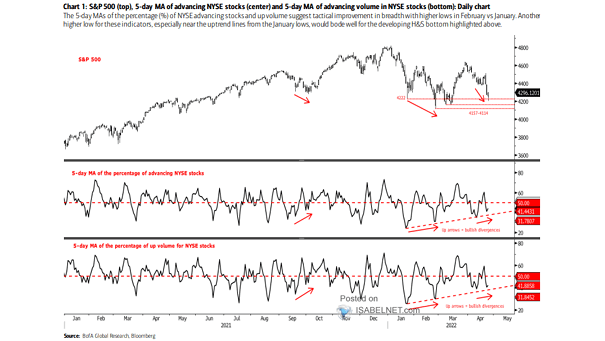
S&P 500 – 5-Day MA of Advancing NYSE Stocks and 5-Day MA of Advancing Volume in NYSE Stocks Can U.S. equity investors expect a relief rally? Image: BofA Global Research
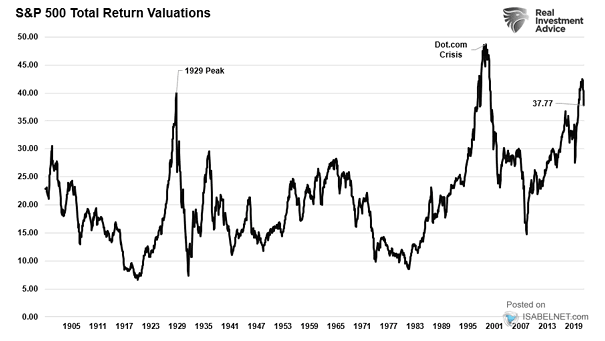
S&P 500 Total Return Valuations Despite the recent sell-off, the valuation of the S&P 500 remains at high levels by historical standards. Image: Real Investment Advice