NYSE Composite Index and 100-Week Moving Average
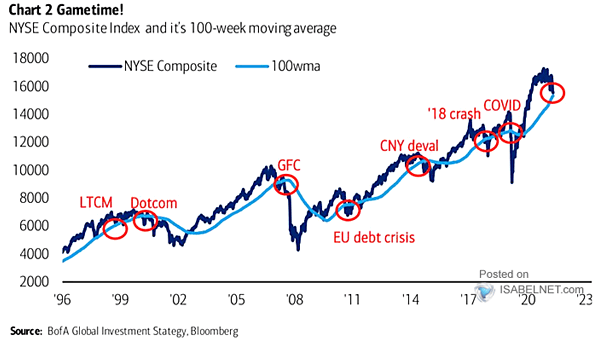
NYSE Composite Index and 100-Week Moving Average Will the NYSE Composite break its 100-week moving average to the downside significantly? Image: BofA Global Investment Strategy
NYSE Composite Index and 100-Week Moving Average Will the NYSE Composite break its 100-week moving average to the downside significantly? Image: BofA Global Investment Strategy
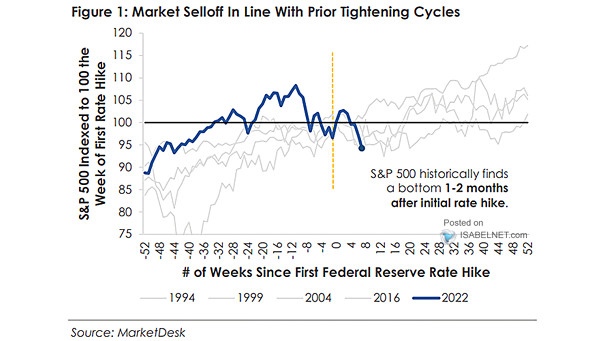
S&P 500 and First Fed Rate Hike Is the bottom near for U.S. stocks? Image: MarketDesk Research
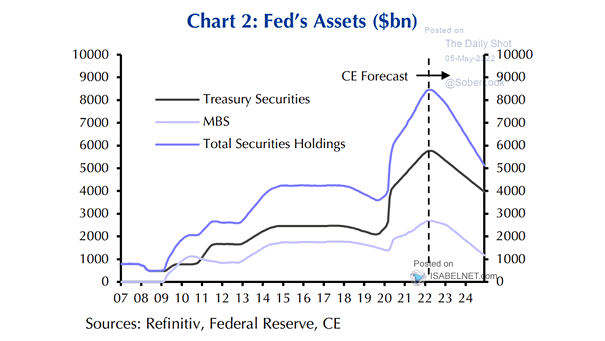
Fed’s Assets The Fed plans to shrink its balance sheet over time. What impact will this have on markets? Image: Capital Economics
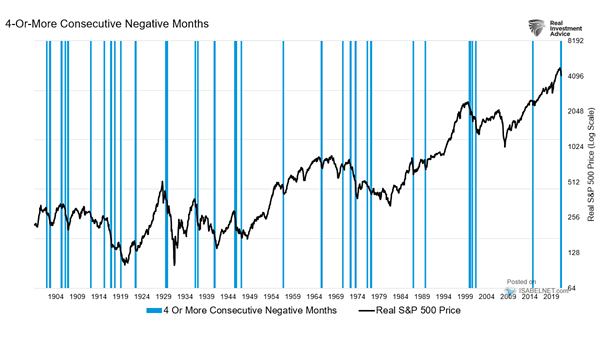
Real S&P 500 Price and 4-or-More Consecutive Negative Months Will the S&P 500 finish green in May? Image: Real Investment Advice
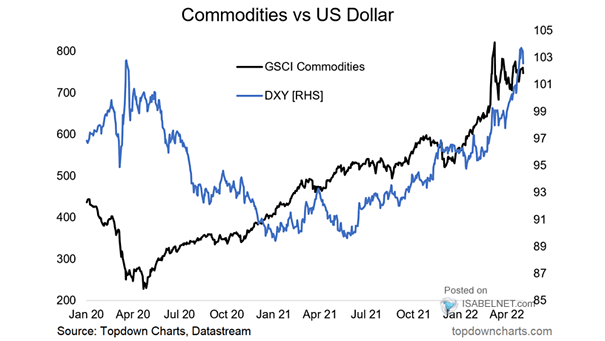
Commodities vs. U.S. Dollar Should longer-term investors remain bullish on commodities amid a strong U.S. dollar? Image: Topdown Charts
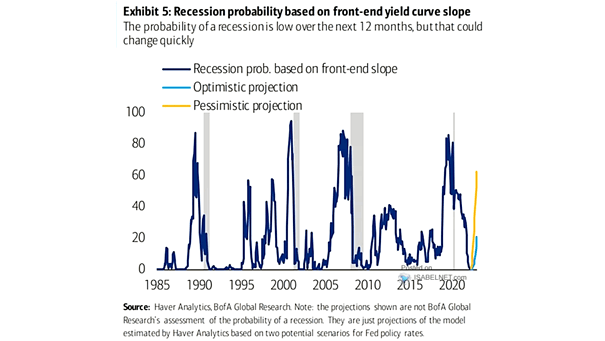
U.S. Recession Probability Based on Front-End Yield Curve Slope The probability of a recession in the United States is still low over the next 12 months. Image: BofA Global Research
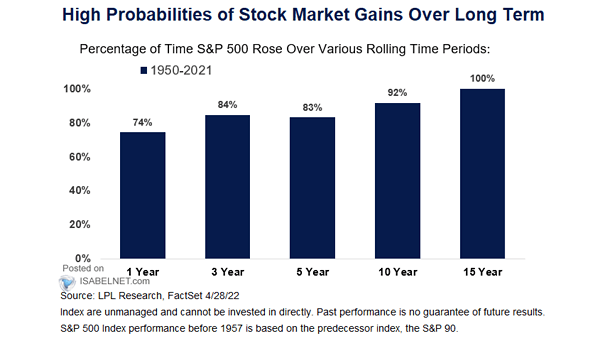
Percentage of Time S&P 500 Rose Over Various Rolling Time Periods As time horizons lengthen, the probability of S&P 500 gains increases. Image: LPL Research
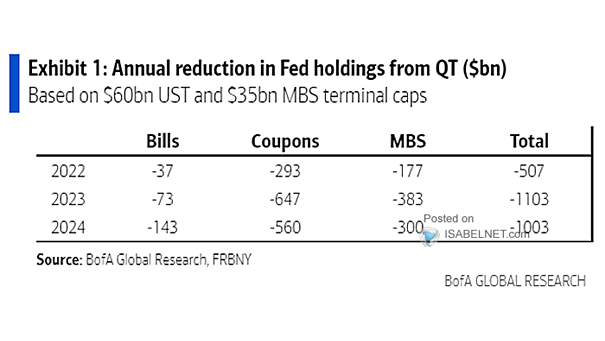
Annual Reduction in Fed Holdings from QT The Fed plans to reduce its balance sheet at an annual rate of about $1.1 trillion. Image: BofA Global Research
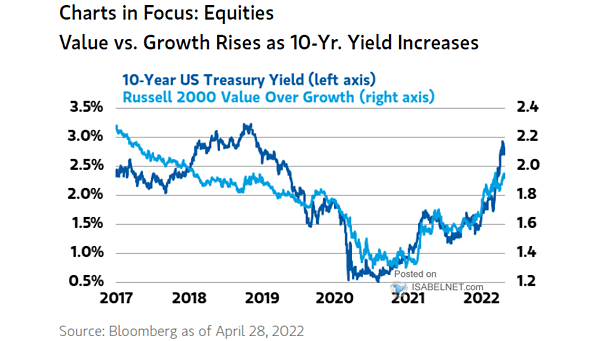
10-Year U.S. Treasury Yield and Value Over Growth (Russell 2000 Index) Should investors continue to favor value over growth stocks? Image: Morgan Stanley Wealth Management
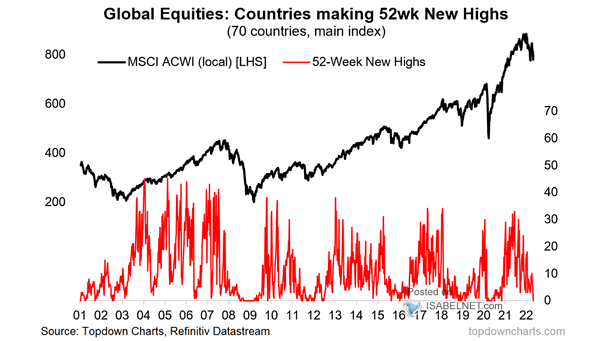
Global Equities – Countries Making 52-Week New Highs Should investors remain cautious on global equities? Image: Topdown Charts
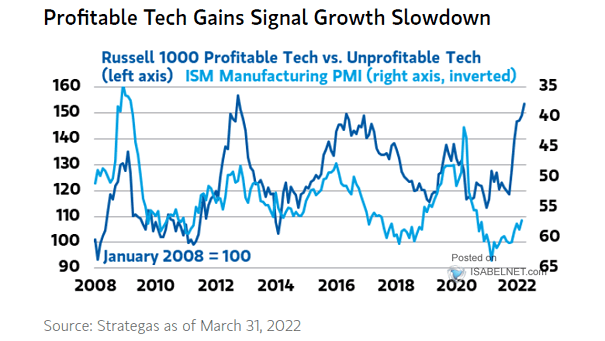
Russell 1000 Profitable Tech vs. Unprofitable Tech and ISM Manufacturing PMI Profitable tech gains suggest growth slowdown. Image: Morgan Stanley Wealth Management